XM does not provide services to residents of the United States of America.

USDCAD

Daily Market Comment – Dollar stumbles ahead of NFP; vaccine hopes shore up equities

Posted on July 2, 2020 at 8:30 am GMT

Dollar torn between upbeat data and US virus spike; NFP may decide fate Positive vaccine news helps breathe life into flagging stock market rally Gold retreats from highs as markets dismiss US-China tensions Dollar looks shaky as jobs report awaited Markets were mostly in risk-on mode on Thursday as the combination of positive economic indicators and potential coronavirus vaccines kept alive hopes of a strong recovery from the pandemic. But with US markets closed on Friday for Independence Day celebrations, [..]
post-image

Technical Analysis – USDCAD gains capped by 200 moving average

Posted on June 30, 2020 at 8:10 am GMT

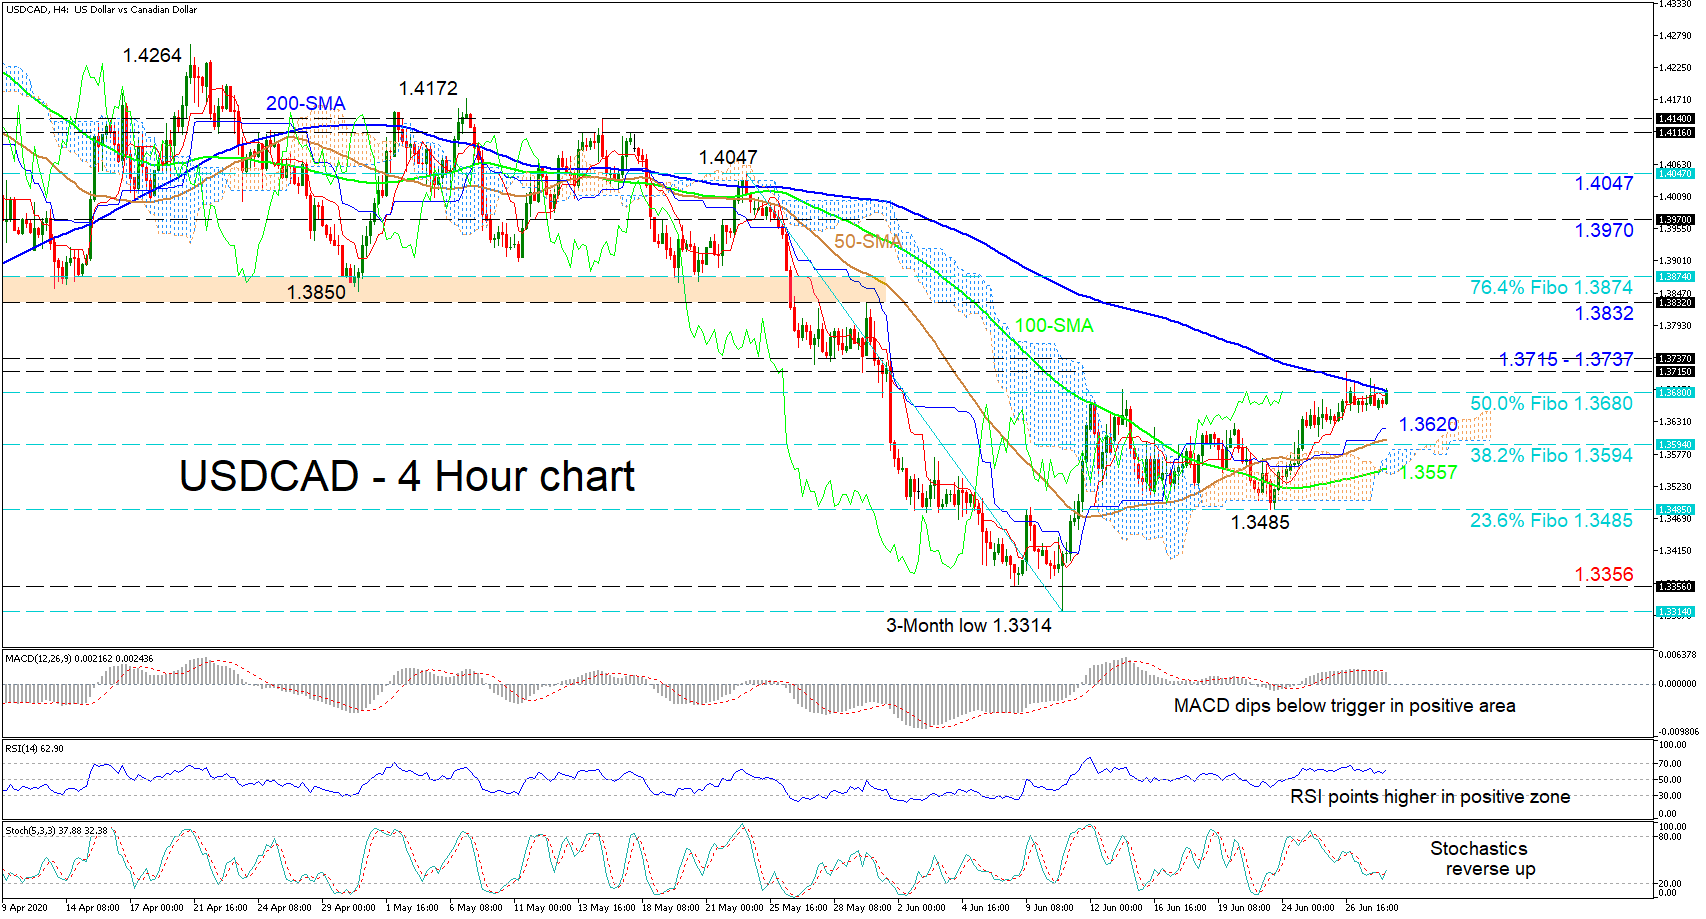
USDCAD is presently tackling the restricting 200-period simple moving average (SMA) residing at the 1.3680 level, that being the 50.0% Fibonacci retracement of the down leg from 1.4047 to 1.3314. The existing bullish tone in the 50- and 100-period SMAs and the positive bearing of the Ichimoku lines further back additional price advances. The technical indicators also back an improving picture in the short-term timeframe. The MACD, in spite of having dipped below its red signal line in the positive [..]

Daily Market Comment – Stocks jump into the green, but dollar doesn’t play along

Posted on June 26, 2020 at 8:06 am GMT

Investors ignore a litany of bad news, push stocks higher on deregulation hopes But FX retains a more cautious tone, dollar holds onto gains as US cases hit new record Texas and Florida “pause” their re-opening plans Rebalancing flows heading into quarter end could bite markets Stocks and dollar focus on different narratives The epic market battle between stimulus-driven bulls and virus-fearing bears seems set to end in a draw this week, as worries of a rapid resurgence in virus [..]

Technical Analysis – USDCAD stuck below 23.6% Fibo; medium-term outlook still negative

Posted on June 26, 2020 at 7:15 am GMT

USDCAD came close to break the 23.6% Fibonacci retracement level of the down leg from 1.4668 to 1.3310, around 1.3635, several times in the preceding week without success. Still, it managed to hold above the 200- and 20-day simple moving averages (SMAs). The market could retain the range-bound trading in the short-term as the RSI is standing near its 50 neutral mark and the MACD is moving along its trigger line and towards zero. However, the %K line of the stochastic oscillator is approaching the overbought zone, suggesting [..]

Daily Market Comment – Markets lose altitude as virus fears escalate

Posted on June 25, 2020 at 8:42 am GMT

Reality bites stock markets as US virus spike accelerates, dollar recovers Threats of new US tariffs against EU and dire IMF forecasts not helping mood Fed balance sheet reduction may be playing a role too Daily virus numbers will continue to dictate sentiment Acceleration in infections hampers recovery prospects Risk aversion gripped global markets once again on Wednesday after several American states reported another worrisome spike in virus cases and hospitalizations, pouring cold water on the cheerful narrative of a [..]

Daily Market Comment – Gold flies to new highs, RBNZ talks kiwi down

Posted on June 24, 2020 at 8:10 am GMT

Dollar retreats after encouraging PMIs turbocharge euro Gold capitalizes on weaker dollar, reaches heights last seen in 2012 Stocks inch higher led by tech, despite US virus spike and rising bankruptcies RBNZ expresses discomfort with exchange rate, kiwi obliges Gold takes advantage of softer dollar Global markets continue to be torn between conflicting narratives, as signs that the world economy has entered the recovery stage – with a little help from a tsunami of stimulus – clash with a worrisome [..]

post-image

Technical Analysis – USDCAD fails to surpass flat SMAs; negative in medium term

Posted on June 23, 2020 at 12:48 pm GMT

USDCAD looks to be flat over the last two weeks but is now penetrating the 23.6% Fibonacci retracement level of the down leg from 1.4170 to 1.3315 at 1.3518, inside the Ichimoku cloud. Also, the price holds beneath the 20- and 40-period simple moving averages (SMAs), confirming the neutral bias and the RSI is keeping some distance from the 50 level, pointing down. However, the stochastic oscillator is completing a bullish crossover within its %K and %D lines in the [..]

Daily Market Comment – Investors grapple with the virus blues

Posted on June 22, 2020 at 8:08 am GMT

Markets struggle for direction as second wave worries intensify WHO reports record increase in global cases, Apple re-closes some US stores Gold spikes higher but FX and stocks still not overly concerned Looking ahead, the battle between stimulus-fueled optimism vs second wave concerns will drive sentiment Emotional rollercoaster continues With the correlation between FX and stock markets going through the roof in recent months as the dollar reclaimed its safe-haven throne, risk sentiment has become the dominant force in the [..]

Technical Analysis – USDCAD consolidates but downside tensions remain  

Posted on June 19, 2020 at 8:07 am GMT

USDCAD currently seems to be prolonging its sideways course, pursuing the 200-day simple moving average (SMA). The horizontal posture within the Ichimoku lines and the 200-day SMA further sponsor this view. The short-term oscillators further emphasize the pause in the market but lean towards a negative bias. The MACD in the negative region has flattened above its red signal line, while the RSI hovers marginally below the 50 mark. That said, the stochastic lines promote a downside direction, as does [..]

post-image

Technical Analysis – USDCAD stalls above 23.6% Fibo; neutral in very short term

Posted on June 16, 2020 at 9:19 am GMT

USDCAD is trading around the vicinity of 1.3575, that being the 20-period simple moving average (SMA) after the rebound on the 23.6% Fibonacci retracement level of the bearish move from 1.4170 to 1.3315 at 1.3518. Looking to the short-term oscillators, the stochastic and the RSI promote slight improvements, despite diminished directional momentum. The stochastic is creating a bullish crossover within the %K and %D lines in the oversold zone, while the RSI is sloping north near the 50 level. Also, [..]

Risk Warning: Your capital is at risk. Leveraged products may not be suitable for everyone. Please consider our Risk Disclosure.