XM does not provide services to residents of the United States of America.

GER30

Technical Analysis – GER 30 index gives up recent highs; looks neutral in short-term

Posted on December 6, 2019 at 8:29 am GMT

The GER30 stock index gave up some ground after stubbornly and unsuccessfully testing the 13,300 region for almost a month. The short-term bias is now viewed as neutral, as the red Tenkan-sen has slowed to meet the blue Kijun-sen line, while the RSI is struggling to hold above its 50 neutral mark. A closing price below Tuesday’s trough of 12,924 and the 50-day exponential moving average (EMA) could encourage more selling, though only a significant decline below 12,660 would put [..]

post-image

Technical Analysis – GER30 index loses steam after fresh 23-month high; uptrend intact

Posted on November 14, 2019 at 12:50 pm GMT

The GER30 stock index paused its rally after registering a fresh-month high of 13,307. The falling RSI, which is trying to exit the overbought area above 70, suggests that the bullish action may be overstretched and it’s time for a downward correction. The easing momentum in the MACD is endorsing the move as well. Yet, in terms of trend, the fact that the price is above its upward-sloping simple moving averages (SMAs) and the Ichimoku cloud hints that the market may likely maintain its upward pattern. The 13,140 [..]

post-image

Technical Analysis – GER30 index bullish bias back on track

Posted on November 4, 2019 at 1:36 pm GMT

GER30 stock index bulls pushed above the 12,985 previous high from October 28, realigning the index with the short-term positive picture. Further backing the positive momentum is the fresh bullish crossover of the upward sloping Tenkan-sen and Kijun-sen lines and the price distancing itself above the Ichimoku cloud. The MACD, still in the positive zone, is increasing above its red trigger line, supporting the positive view. The upward sloping RSI has ascended into the overbought territory, also supporting further advances. [..]

post-image

Technical Analysis – GER30 index pauses despite bullish bias

Posted on October 18, 2019 at 12:58 pm GMT

GER30 stock index bulls have consolidated around the 12661 (resistance-turned-support) level of July 4. The bulls tried to extend higher, but sellers reversed the price back down to 12,590, which is the 23.6% Fibonacci retracement of the up leg from 11,878 to 12,815. Despite the sideways move, the short-term oscillators now lean towards an improving market. The RSI is reflecting a minor improvement in positive momentum as it has turned back up in bullish territory, looking to reclaim the 70 [..]

post-image

Technical Analysis – GER30 index rallies above 200-period SMA

Posted on October 11, 2019 at 1:46 pm GMT

GER30 stock index extended higher as the bulls overcame the key resistance of 12,150, where the 50- and 200-period simple moving averages (SMAs) crossed each other. The bulls seem to still be in control as backed by the upward sloping 200-period SMA and the recent turning up of the 50- and 100-period SMAs. The short-term oscillators reflect positive momentum is intact. The MACD is ascending and has distanced itself above its red trigger line and into the positive region, while [..]

post-image

Technical Analysis – GER30 index supported by Ichimoku cloud after bearish breakout

Posted on September 23, 2019 at 10:04 am GMT

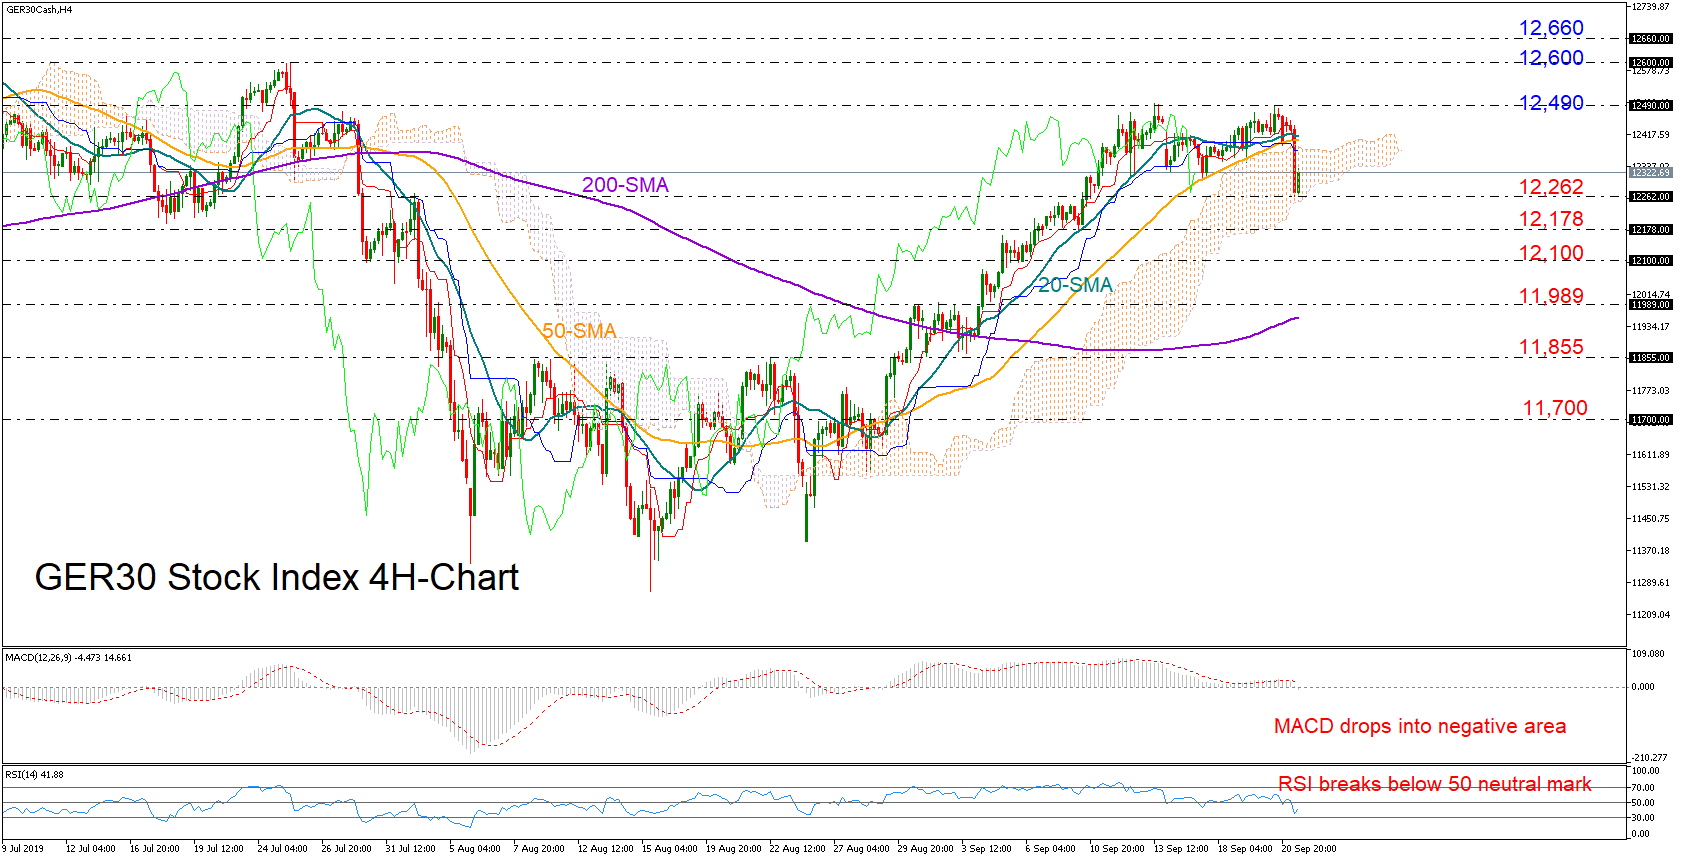
GER30 stock index corrected sharply to the downside and under the 12,300 support level in the face of worse-than-expected PMI readings out of Germany and the whole Eurozone on Monday. Traders are currently waiting to see whether the bears can next breach the bottom of the Ichimoku cloud in the four-hour chart as the short-term bias has switched from neutral to bearish according to the RSI and the MACD. Slipping below the cloud and the 12,262 number, the price may [..]

post-image

Technical Analysis – GER30 index completes another bullish week near overbought zone

Posted on September 12, 2019 at 2:12 pm GMT

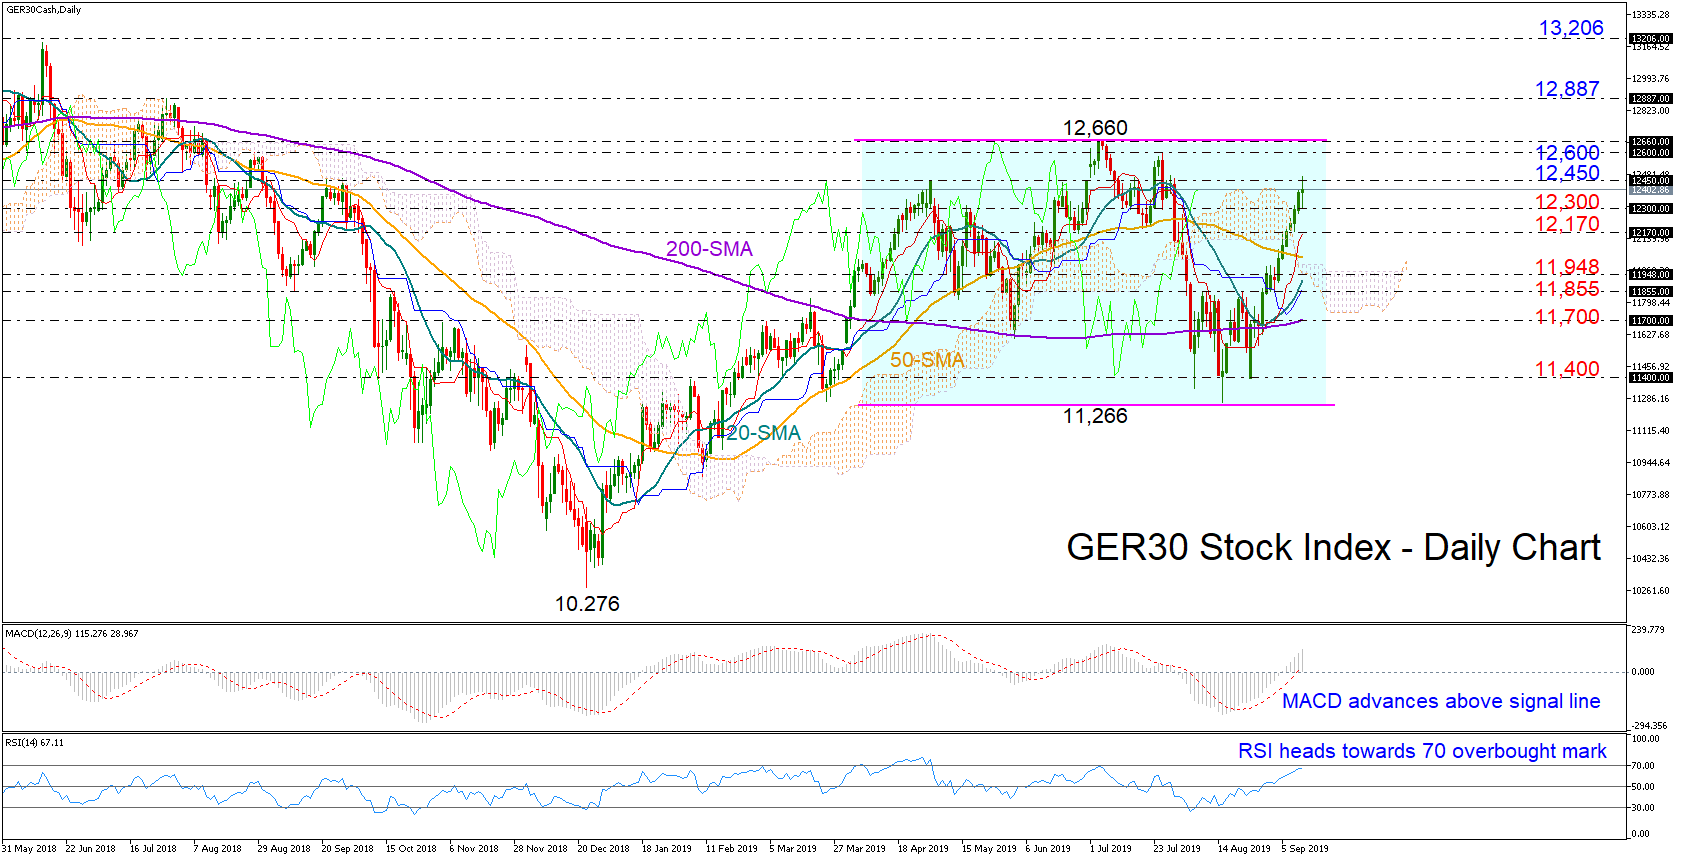
GER30 stock index had two constructive weeks and is completing another one above the Ichimoku cloud and its simple moving averages (SMAs) in the daily chart. Technically, the market may run for more gains in the short-term as the MACD and the RSI strengthen to the upside in the positive area. The latter, however, should warrant some caution for bullish traders as the indicator is ready to crawl above its 70 overbought mark. Above the 12,450 resistance level, the market [..]

post-image

Technical Analysis – GER30 index gains ground above 200-SMA; looks overbought

Posted on September 5, 2019 at 11:46 am GMT

The GER30 index stepped on the 200-period simple moving average (SMA) on Wednesday and accelerated to one-month highs. While the RSI’s peak in the overbought territory suggests that the rally is overstretched and is time for a downside correction, the positive momentum in the MACD and the upward direction in the red Tenkan-sen line signals that any weakness could be temporary.  Even more encouraging is the bullish cross between the 20- and the 200-period SMAs that foresees the continuation of [..]

post-image

Technical Analysis – GER30 index consolidates above the 11,338 level; SMAs converge

Posted on August 28, 2019 at 3:31 pm GMT

The GER30 index has consolidated in a sideways market in the last 20 sessions, as the 50-period simple moving average (SMA) has flattened and blended with the 100-period SMA. The index has currently moved into the Ichimoku cloud, trading around the June low of 11,607. Directional momentum seems to have evaporated, something also reflected by the indicators. The MACD is flat at the zero line, combined with its red trigger line, while the RSI hovers at the 50-level. Furthermore, the [..]

post-image

Technical Analysis – GER30 index closes above the 50-SMA and downtrend line

Posted on August 19, 2019 at 3:22 pm GMT

The GER30 index put in a rally, pushing upwards off the 11,266 low of August 15. The price surpassed 11,580, which is the 23.6% Fibo of the down leg from 12,600 to 11,266 and near the resistance of 11,607 from June 3. More importantly the appreciation of price moved above the 50-period simple moving average (SMA) and downtrend line to enter the Ichimoku cloud. Although the momentum indicators suggest a short-term positive directional trend in place, traders should be cautious [..]

Risk Warning: Your capital is at risk. Leveraged products may not be suitable for everyone. Please consider our Risk Disclosure.