XM does not provide services to residents of the United States of America.

GBPUSD

post-image

Technical Analysis – GBPUSD downside risk; 50-day MA supports
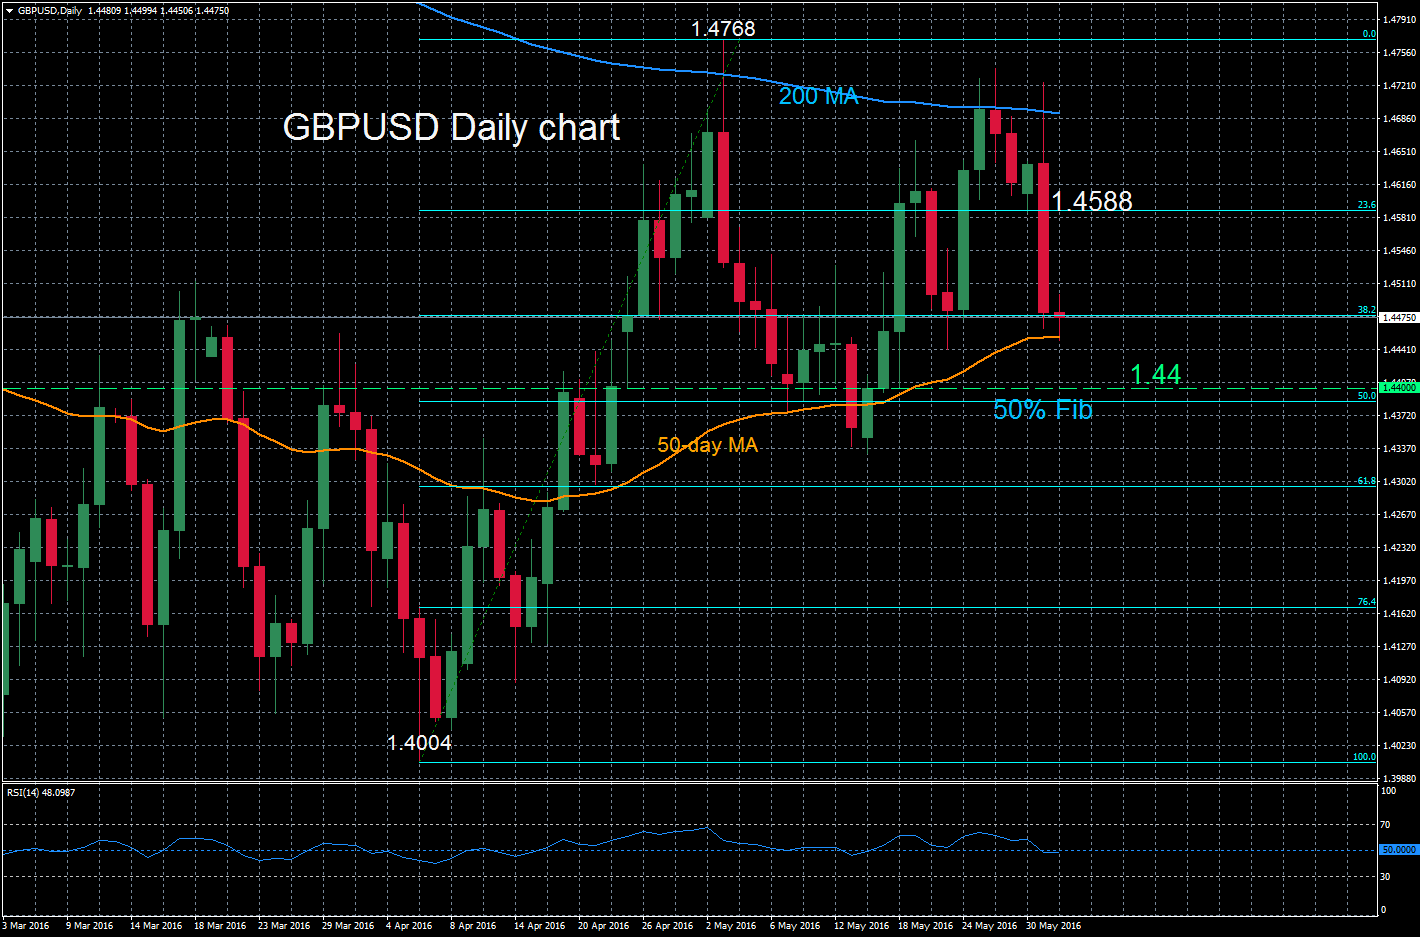
Posted on June 1, 2016 at 7:13 am GMT

GBPUSD is now forming a neutral bias after the bullish move from 1.4004 to 1.4768 stalled and the market is consolidating just above the 50% Fibonacci of this upleg from April to May. This Fibonacci level lies just below the key psychological 1.44 level at 1.4386. The high of 1.4768 is the extent of the bullish phase and the short term bias has shifted to neutral, and will remain so as long as the market remains above the 50% Fibonacci. [..]

post-image

Technical Analysis – GBPUSD tests 1.45 area after correcting recent uptrend

Posted on May 5, 2016 at 6:45 am GMT

After a steady rise from the key 1.4000 level, GBPUSD reached the 200-day moving average this week but was unable to close above it. This proved to be a strong resistance area and consequently the pair reversed back down. The level at 1.4670 has also proven to be a strong resistance level, which after several tests at this level, prices failed to close above it and fell back down to now test the 1.45 area, an important support level. In [..]

post-image

Technical Analysis – GBPUSD gains upside momentum to reach 2-month high

Posted on April 26, 2016 at 7:08 am GMT

GBPUSD has turned more bullish in the short term after rising to a two-month high of 1.4518 on Monday and is currently consolidating gains at this level. This area is the upper end of the range the pair has been trading in since early March. Prices moved above the daily Ichimoku cloud a week ago and the tenkan-sen line has crossed above the kijun-sen line, giving a bullish signal. Other technical indicators have turned bullish also, such as the RSI [..]

post-image

Technical Analysis – GBPUSD pauses decline, rises above 1.40

Posted on March 29, 2016 at 7:21 am GMT

GBPUSD has stabilized just above the key 1.40 level and is in a neutral phase in the short term. The strong rebound that took the pair back above 1.40 from 1.3834 suggests that a short-term bottom is in place. For now the risk for further GBPUSD weakness has diminished, as the MACD has risen above zero into bullish territory. Sideways consolidation in a range between 1.4050 and 1.4400 is expected. RSI is still weak so a sustained up-move is not [..]

post-image

Technical Analysis – GBPUSD rise ends at 50dma resistance

Posted on March 15, 2016 at 8:07 am GMT

GBPUSD found strong resistance at the 50-day moving average and has moved back down after several tests at this level around 1.4365. The pair is now testing support provided by the 50% Fibonacci retracement level of the decline from 1.4667 to 1.3834. A daily close below this 50% Fibonacci level at 1.4248 would strengthen the bearish bias. Momentum has turned negative which is a bearish signal – RSI has fallen and is testing the 50 level. There is now scope [..]

post-image

Technical Analysis – GBPUSD struggles below 1.40, bearish outlook remains

Posted on March 1, 2016 at 7:46 am GMT

GBPUSD has been struggling to rise back above the key 1.40 level after breaking below it on February 24. The technical indicators are supporting further downside. The three moving averages are negatively aligned (50MA, 100MA and 200MA) and are falling. MACD is below zero and trending down, while RSI is in bearish territory below 50. However, since RSI is close to oversold territory this may suggest some consolidation in the near term, so prices may pause their decline for now. [..]

post-image

Technical Analysis – GBPUSD technicals suggest resumption of downtrend

Posted on February 17, 2016 at 7:52 am GMT

GBPUSD is giving a bearish tone. The RSI is in bearish territory below 50 and trending down, which is suggesting there is further downside momentum. The alignment of the 200, 100 and 50-day moving averages and the fact they are all sloping downwards, are bearish signals. After prices attempted to bounce higher from multi-year lows of 1.4078, strong resistance was found at the 50-day moving average and prices reversed back down from 1.4667. A drop below the key psychological level [..]

post-image

Technical Analysis – GBPUSD breaches key 1.45 level but rally fades

Posted on February 4, 2016 at 7:41 am GMT

GBPUSD broke above a key resistance level of 1.4500 on Wednesday to reach a one-month high of 1.4648. This is close to the 50% Fibonacci level of the retracement from 1.5238 to 1.4078 (December to January drop). This level lies at 1.4657. For a shift to a bullish bias, strong upside momentum is needed, otherwise the market may find it a challenge to break above this strong resistance level at the 50% Fibonacci. The recent rally could just be a [..]

post-image

Technical Analysis – GBPUSD in descending channel, support at 1.41

Posted on January 27, 2016 at 7:59 am GMT

GBPUSD has been falling in a descending channel for a month. The lower channel line has provided support but prices have managed to rise outside the upper channel resistance line. The market is now testing 2-week highs and has found resistance at 1.4366. If prices continue to move up beyond 1.4380, then the 1.4500 level is the next barrier to the upside. If prices move down, there is important support at 1.4100, which if broken, would see another leg to [..]

post-image

Technical Analysis – GBPUSD increasingly bearish after falling out of down sloping channel

Posted on January 8, 2016 at 7:56 am GMT

GBPUSD has fallen out of the downward sloping channel and has turned increasingly bearish this week. A 5-year low of 1.4532 was touched on Thursday at 1.4532. The technical indicators are bearish, with the tenkan and kijun lines negatively aligned and pointing downward. The daily Ichimoku cloud is falling and the market is below it. The RSI is in bearish territory below 50 and entering oversold levels. The market has scope to target the June 2010 low of 1.4345. [..]

Risk Warning: Your capital is at risk. Leveraged products may not be suitable for everyone. Please consider our Risk Disclosure.