Tome decisões de trading informadas
Enriqueça o conhecimento e decisões sobre negociação com uma variedade de recursos úteis, na ponta dos dedos.
Ter acesso total Aviso de risco: negociação forex e de CFDs envolvem um risco elevado de perda. T&Cs aplicam-se.Mantenha-se à frente do mercado
Assim que abrir uma conta na XM, pode aceder a todas estas ferramentas valiosas.
Notícias da Reuters
Atualizações de mercado 24/7 diretamente da conceituada agência de notícias Reuters.
Atualizações Reuters
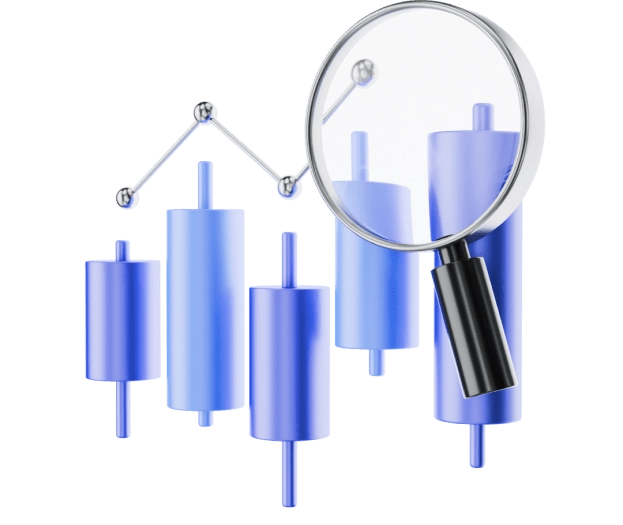
Análise de mercados diária
Obtenha a mais recente vista de mercado dos ativos com maior tendência da nossa equipa de análise de mercado.
Ver análise
Podcast XM
Inclua os conhecimentos de negociação na sua agenda diária. Basta premir o play e continuar com o seu dia.
Ouvir agora
XM TV
Veja vídeos XM sem interrupções para obter atualizações do mercado e descobrir os nossos produtos mais vendidos.
Ver XM TV
Combine notícias com ferramentas analíticas
Porquê limitar-se às notícias quando também pode ter acesso a ferramentas analíticas avançadas?

Trading Central
Descubra novas oportunidades de mercado com as ferramentas galardoadas da Trading Central.
Ler mais
Calendário económico
Mantenha-se a par de todos os acontecimentos económicos que possam afetar a sua negociação e faça planos informados.
Ler mais
Calculadoras de trading
Defina as negociações com requisitos precisos de margem, valor de pip e swap.
Ler maisIsenção de responsabilidade: as entidades do XM Group fornecem serviço apenas de execução e o acesso à nossa unidade de negociação online, que permite a uma pessoa ver e/ou usar o conteúdo disponível no ou através do website, não se destina a alterar ou expandir este facto, nem altera ou expande este facto. O acesso e a utilização estão sempre sujeitos a: (i) Termos e condições; (ii) Avisos de risco; e (iii) Exoneração total de responsabilidade. Por conseguinte, estes conteúdos são fornecidos apenas a título de informação geral. Em particular, tenha em consideração que o conteúdo da nossa unidade de negociação online não constitui uma solicitação nem uma oferta para a realização de quaisquer negociações nos mercados financeiros. A negociação em qualquer mercado financeiro envolve um nível significativo de risco para o capital.
Todo o material publicado na nossa unidade de negociação online destina-se apenas a fins educativos/informativos e não contém, nem deve ser considerado como conter, conselhos e recomendações financeiras, de investimento ou de negociação; ou um registo dos nossos preços de negociação; ou uma oferta de, ou solicitação de, uma negociação em quaisquer instrumentos financeiros; ou promoções financeiras não solicitadas.
Qualquer conteúdo de terceiros, bem como conteúdo preparado pela XM, tais como: opiniões, notícias, pesquisas, análises, preços e outras informações ou links para websites de terceiros contidos neste website são fornecidos “tal como estão”, como comentários gerais de mercado, e não constituem conselhos de investimento. Na medida em que qualquer conteúdo seja interpretado como um estudo de investimento, o utilizador deve ter em conta e aceitar que o conteúdo não se destina e não foi preparado conforme os requisitos legais destinados a promover a independência dos estudos de investimento e, como tal, seria considerado uma comunicação de marketing ao abrigo das leis e regulamentos relevantes. Certifique-se de que leu e compreendeu a nossa notificação relativa à pesquisa sobre investimentos não-independentes e o aviso risco relativamente à informação acima referida, que pode ser acedida na Área de Membros.