Treffen Sie fundierte Trading-Entscheidungen
Mit hilfreichen Informationsquellen erweitern Sie Ihr Wissen und optimieren Ihre Trading-Entscheidungen.
Vollen Zugang bekommen Risikowarnung: Der Handel mit Devisen und CFDs birgt ein hohes Verlustrisiko. Es gelten die AGB.Ihr Vorsprung auf dem Finanzmarkt
Direkt nach Eröffnung Ihres XM-Kontos haben Sie Zugriff auf diese nützlichen Tools.
News von Reuters
Markt-Updates: 24/7 direkt von der renommierten Nachrichtenagentur Reuters
News von Reuters erhalten
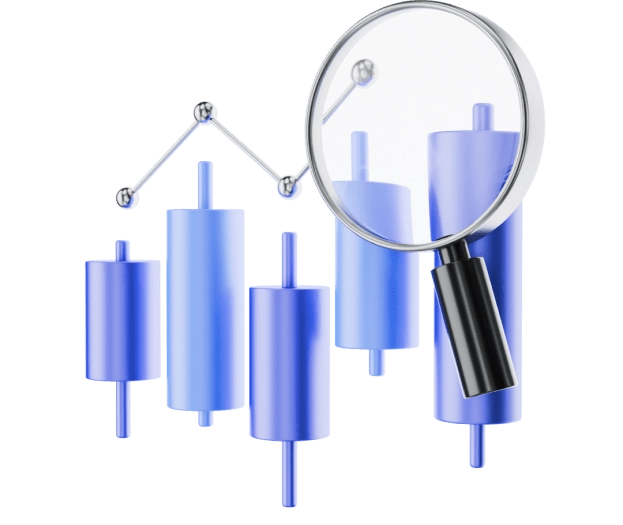
Tägliche Marktanalyse
Unser Marktkompetenz-Team liefert Ihnen aktuelle Marktanalysen zu den beliebtesten Finanzinstrumenten.
Aktuelle Analysen aufrufen
XM-Podcast
Erweitern Sie Ihre Trading-Kenntnisse und meistern Sie die täglichen Herausforderungen – unabhängig von Ort und Zeit. Mit unserem Podcast genießen Sie absolute Flexibilität.
Jetzt Podcast hören
XM TV
Mit den XM-Videos sind Sie immer über das Marktgeschehen und unsere beliebtesten Produkte informiert.
XM TV anschauen
Vereinte Kräfte: News und Analyse-Tools
Mit unseren Nachrichten sind Sie bestens informiert. Zusätzlich bieten wir Ihnen modernste Analysetools, damit Sie Ihre Pläne in die Tat umsetzen können.

Trading Central
Mit den mehrfach preisgekrönten Tools von Trading Central finden Sie neue Chancen auf den Finanzmärkten.
Mehr erfahren
Wirtschaftskalender
Dank unserem Wirtschaftskalender bleiben Sie über alle wichtigen Ereignisse am Markt immer auf dem neuesten Stand. Diese Informationen sind die Grundlage für fundierte Trading-Entscheidungen.
Mehr erfahren
Trading-Rechner
Ermitteln Sie für Ihre Trades die entscheidenden Parameter, darunter die exakte Margin, den Pip-Wert und die Swap-Anforderungen.
Mehr erfahrenRechtlicher Hinweis: Die Dienstleistungen der XM Group beschränken sich auf die Handelsausführung und den Zugang zu unserer Online-Handelsumgebung. Diese ermöglicht es den Nutzern, die auf der Website verfügbaren Inhalte zu betrachten und/oder zu nutzen. Eine Änderung oder Erweiterung dieses Grundsatzes ist nicht vorgesehen. Für den Zugang gelten stets die folgenden Bestimmungen: (i) Allgemeine Geschäftsbedingungen; (ii) Risikowarnungen und (iii) Vollständiger rechtlicher Hinweis. Die bereitgestellten Inhalte dienen ausschließlich der allgemeinen Information. Wir weisen darauf hin, dass die Inhalte unserer Online-Handelsumgebung weder eine Aufforderung noch ein Angebot zum Handel an den Finanzmärkten darstellen. Der Handel an den Finanzmärkten ist mit einem erheblichen Risiko für Ihr eingesetztes Kapital verbunden.
Alle in unserer Online-Handelsumgebung veröffentlichten Materialien dienen ausschließlich Bildungs- und Informationszwecken. Sie stellen keine Finanz-, Anlage-, Steuer- oder Handelsberatung dar und dürfen auch nicht als solche aufgefasst werden. Darüber hinaus enthält unser Material keine Aufzeichnung unserer Handelskurse, kein Angebot und keine Aufforderung zum Handel mit Finanzinstrumenten sowie keine unaufgeforderte Werbung für Finanzprodukte.
Alle Inhalte von Dritten und die von XM bereitgestellten Inhalte sowie die auf dieser Internetseite veröffentlichten Meinungen, Nachrichten, Forschungsergebnisse, Analysen, Kurse sowie sonstige Informationen und Links zu Internetseiten Dritter werden ohne Gewähr bereitgestellt. Sie sind als allgemeine Kommentare zum Marktgeschehen zu verstehen und stellen keine Anlageberatung dar. Soweit ein Inhalt als Anlageforschung aufgefasst wird, müssen Sie beachten und akzeptieren, dass der Inhalt nicht in Übereinstimmung mit gesetzlichen Bestimmungen zur Förderung der Unabhängigkeit der Anlageforschung erstellt wurde. Somit ist der Inhalt als Werbemitteilung unter Beachtung der geltenden Gesetze und Vorschriften anzusehen. Bitte beachten Sie unseren Hinweis auf die nicht unabhängige Anlageforschung und die Risikowarnung im Hinblick auf die vorgenannten Ausführungen. Die Informationen können im Mitgliedsbereich abgerufen werden.