XM does not provide services to residents of the United States of America.

Technical Analysis

post-image

Technical Analysis – BTCUSD consolidates as declines pauses

Posted on August 24, 2023 at 10:41 am GMT

After a prolonged period of sideways trading during the summer months, BTCUSD (Bitcoin) experienced a vast sell-off, dropping to a fresh two-month low of 25,350. Nevertheless, the king of cryptos appears to have temporarily paused its decline, with the price trading without clear direction for the past few sessions. The momentum indicators currently suggest that bearish pressures are fading. Specifically, both the RSI and the stochastic oscillator managed to escape their oversold territories, hinting that the latest drop might have been [..]

post-image

Technical Analysis – GER 40 index trims losses but is not out of the woods

Posted on August 24, 2023 at 9:35 am GMT

The German 40 index (cash) corrected higher after completing a bullish morning star pattern near its July low of 15,455 and just above the 23.6% Fibonacci retracement of the October 20222-August 2023 uptrend. The 200-day exponential moving average (EMA) made this area important to watch as well. The rising RSI is an encouraging sign of an improving market sentiment, but the indicator has yet to confirm a bullish bias above its 50 neutral mark. Likewise, the MACD is still hovering around [..]

post-image

Technical Analysis – WTI oil futures extend slide below 80

Posted on August 24, 2023 at 8:06 am GMT

WTI oil futures (October delivery) have been steadily losing ground after peaking at the nine-month high of 84.15 on August 10. Moreover, bearish pressures have not shown any sign of easing despite the completion of a golden cross between the 50- and 200-day simple moving averages (SMAs). The momentum indicators currently suggest that bearish forces are holding the upper hand. Specifically, the MACD is softening below its red signal line but remains positive, while the RSI crossed below its 50-neutral threshold. Should the [..]

post-image

Technical Analysis – AUDUSD steps on the 2020 support trendline

Posted on August 24, 2023 at 7:38 am GMT

AUDUSD stayed above the 2020 support trendline after testing it for the third time since the pandemic fallout. This happened after a bearish five-week streak that caused the price to drop to a nine-month low of 0.6363. The pair is set to post its first weekly gain in five weeks as the price picks up positive momentum towards its 20-day simple moving average (SMA) at 0.6511. The upside reversal in the RSI and the Stochastic oscillator are promoting the upturn in the [..]

post-image

Technical Analysis – JP 225 index attempts rebound; bearish structure holds

Posted on August 23, 2023 at 2:21 pm GMT

The JP 225 index (cash) has been experiencing a downside correction after posting a new record high of 34,006 in mid-June. Even though the price managed to halt its retreat and recoup minor losses, its structure of lower highs and lower lows remains intact. The momentum indicators currently suggest that bullish forces are slowly picking up. Specifically, the stochastic oscillator is ascending after posting a bullish cross in the oversold zone, while the RSI gained some ground but holds below its 50-neutral mark. [..]

post-image

Technical Analysis – Nvidia eyes record high ahead of earnings

Posted on August 23, 2023 at 11:51 am GMT

Nvidia has been the best performing stock of the S&P 500 in 2023, gaining around 300% and marching to consecutive higher highs.  Despite experiencing a pullback below its 50-day simple moving average (SMA) for the first time in eight months, the stock bounced back and is set to revisit its record high ahead of its earnings report later on Wednesday. The momentum indicators are endorsing this latest advance. Specifically, the stochastic oscillator is ascending near the overbought zone, while the [..]

post-image

Technical Analysis – Gold leans on the bullish side

Posted on August 23, 2023 at 9:58 am GMT

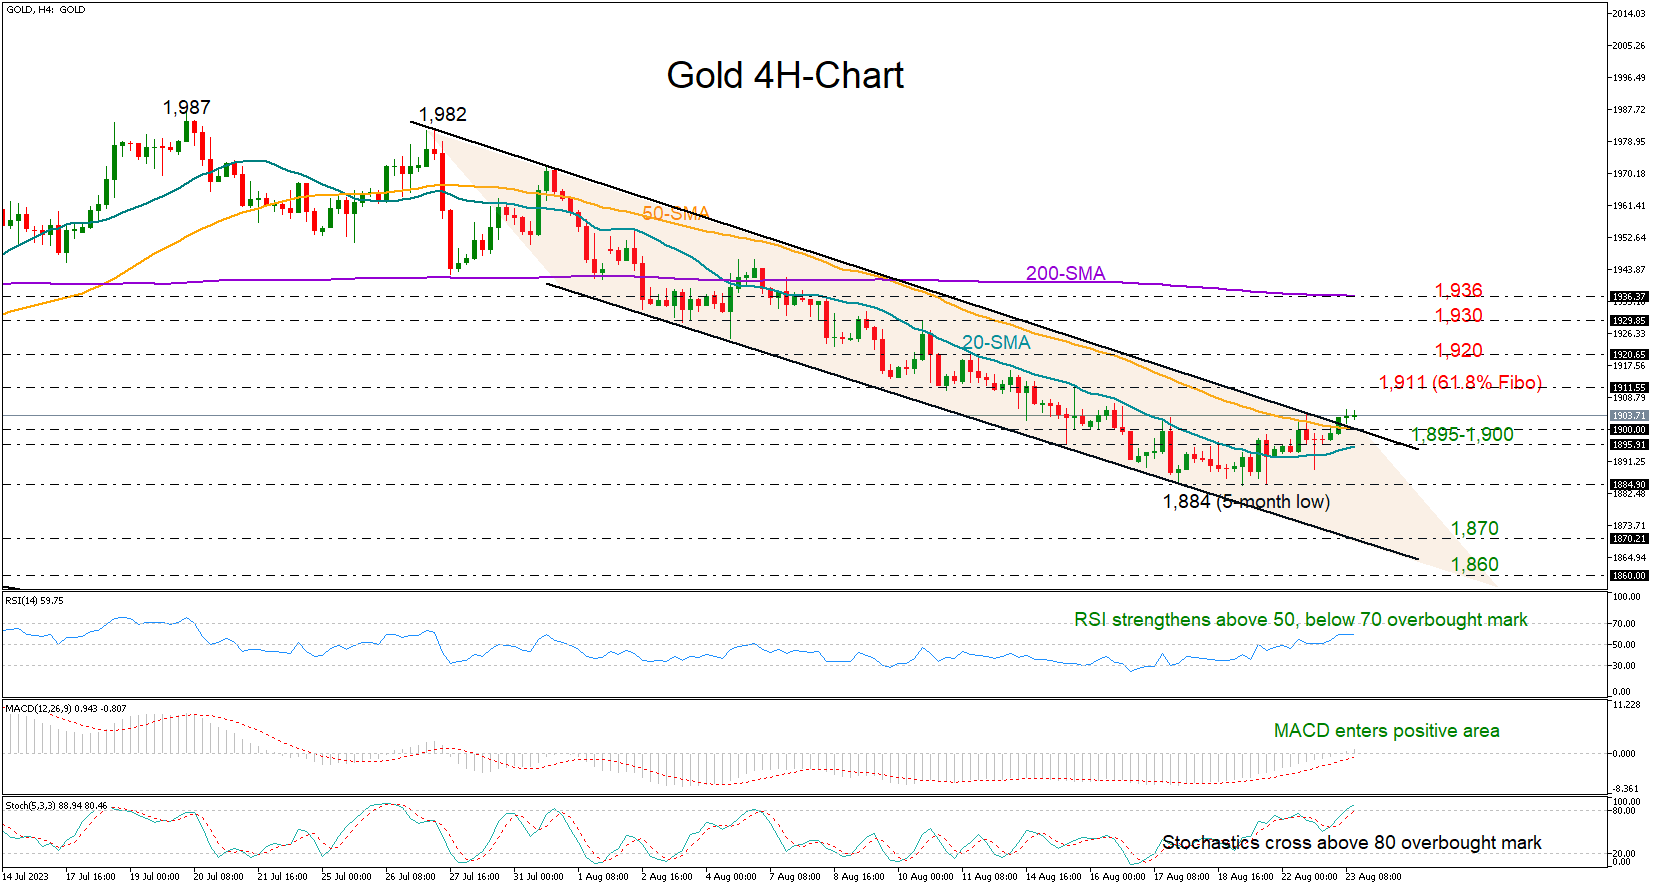
Gold is looking to exit a bearish channel in the four-hour chart after its sell-off stalled around the 1,884 level. Encouragingly, the precious metal has surpassed its 20- and 50-period simple moving averages (SMAs), making its latest rebound more credible. The positive momentum in the technical indicators is further boosting hopes for an upside reversal; the MACD has entered the positive region for the first time since the end of July, while the RSI is clearly trending up above its 50 neutral mark. [..]

post-image

Technical Analysis – NZDUSD halts decline at 61.8% Fibonacci

Posted on August 23, 2023 at 8:39 am GMT

NZDUSD has been in a steep decline after peaking at the five-month high of 0.6410 in July. However, the pair has managed to temporarily pause its retreat following its bounce off 0.5902, which is the 61.8% Fibonacci retracement of the 0.5510-0.6536 upleg. The short-term oscillators currently suggest that positive momentum is picking up but bearish forces remain in control. Specifically, the MACD is strengthening but holds below both zero and its red signal line, while the RSI is hovering deep in the [..]

post-image

Technical Analysis – Will USDJPY stage a new bearish cycle?

Posted on August 23, 2023 at 7:50 am GMT

USDJPY topped twice around the 146.40 barrier from last November, but a negative trend reversal cannot be warranted yet. The RSI has changed direction to the downside after peaking near its 70 overbought mark, while the MACD has slowed down in the positive area. Still, the latter has not crossed below its red signal line, while the Stochastic oscillator is poised for an upside reversal soon after retreating below its 80 overbought level, witnessing some persisting buying interest. Sellers might wait [..]

post-image

Technical Analysis – Silver trapped inside a triangle pattern

Posted on August 22, 2023 at 2:32 pm GMT

Silver prices are trading above a long-term uptrend line taken from the lows of September, but below a downtrend line drawn from the peaks in May. The combination suggests silver is locked inside a symmetrical triangle pattern, a break of which will likely reveal the next major directional wave.  Momentum oscillators paint a relatively neutral picture. The RSI is testing its 50 level, and although the MACD is negative, it has crossed above its red trigger line. Neither indicator is [..]

Risk Warning: Your capital is at risk. Leveraged products may not be suitable for everyone. Please consider our Risk Disclosure.