XM does not provide services to residents of the United States of America.

Technical Analysis

Technical Analysis – USDCHF opens the door to more upside

Posted on September 7, 2023 at 7:53 am GMT

USDCHF stepped above the 0.8890 restricted zone on Wednesday, fueling hopes that the recovery could pick up momentum during the next sessions. The technical indicators are endorsing the bullish scenario as the RSI and the MACD are clearly trending higher and above their neutral marks. The stochastic oscillator is sloping upwards too, though it has already crossed above its 80 overbought level, feeding speculation that additional gains could soon take halt. The 0.8980-0.8995 region, which encapsulates the 50% Fibonacci level of the [..]

post-image

Technical Analysis – US 30 cash index bearish move could have legs

Posted on September 7, 2023 at 7:37 am GMT

The US 30 cash index is recording another red candle as the bears are trying to push the index below the recent low of 34,024 and form a bearish structure of lower lows and lower highs. This appears to be the first proper reaction from the bears since the US 30 cash index set a new 17-month high of 35,686 on July 27, 2023. The current bearish pressure is clearly depicted in the momentum indicators. More specifically, the RSI has again dipped below [..]

post-image

Technical Analysis – Moderna rebound runs out of steam as 50-MA caps gains

Posted on September 6, 2023 at 2:09 pm GMT

Moderna stock posted a successful rebound from the 33-month low of 94.70 it set in August, but its comeback attempt was thwarted by the 50-day simple moving average (SMA). The price is currently heading lower with momentum indicators also pointing down. The RSI has just slipped below the 50-neutral level, while the fast (%K) stochastic is about to enter the oversold region. However, the MACD has remained close to zero and is holding above its red signal line for now, [..]

post-image

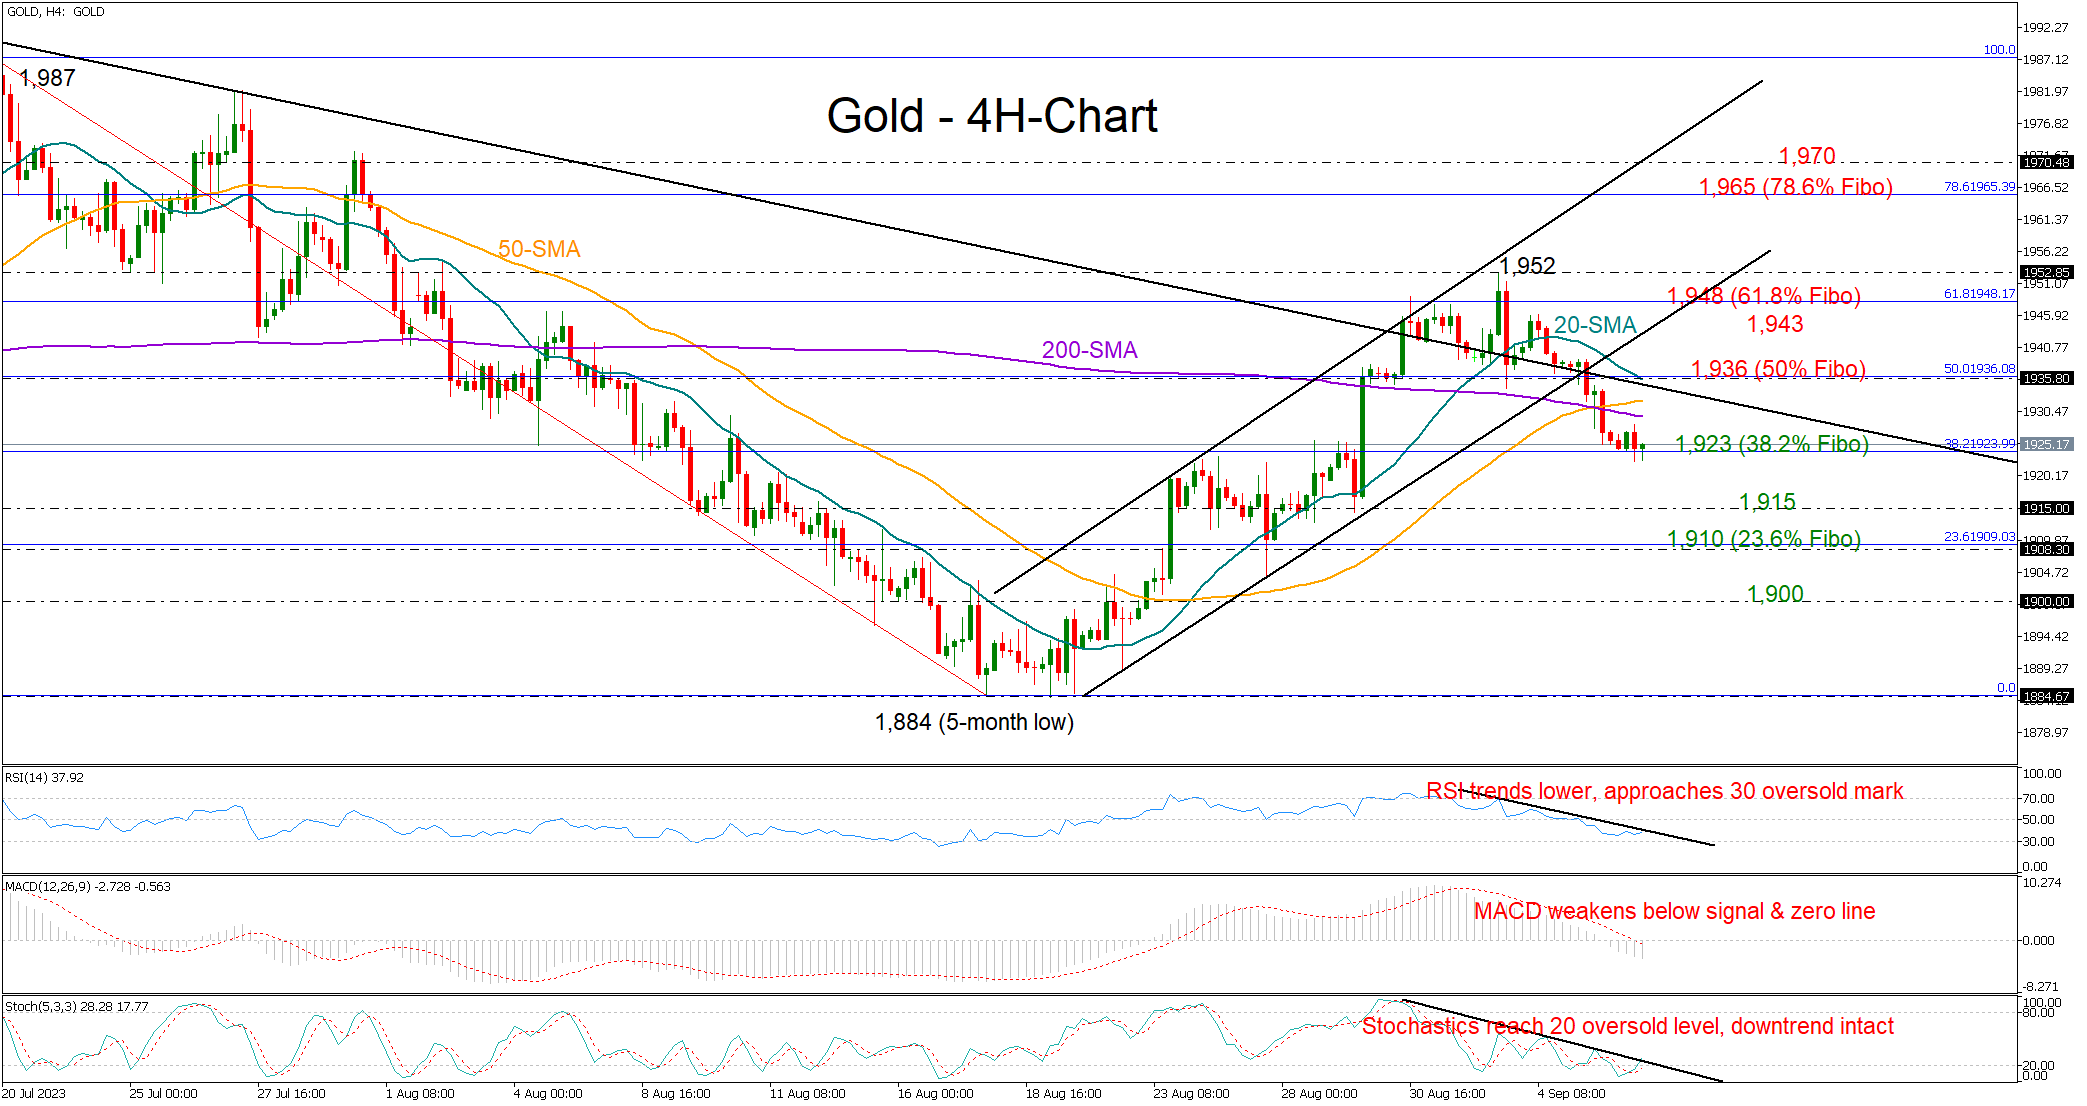
Technical Analysis – Gold returns to bearish area

Posted on September 6, 2023 at 10:11 am GMT

Gold came under fresh selling pressure after rising as high as 1,952 in the first trading day of September, exiting the rising channel in the four-hour chart and pulling back into the May-August bearish channel. The price is currently looking for a rebound around the 38.2% Fibonacci retracement of the 1,987-1,884 downtrend at 1,923, but the technical signals are not promising. Although the stochastic oscillator is sending oversold signals, the falling RSI has yet to cross below 30, while the MACD has started a new [..]

post-image

Technical Analysis – Could EURGBP bulls react to the mounting bearish pressure?

Posted on September 6, 2023 at 8:10 am GMT

EURGBP is registering its first green candle after five consecutive red candles as the bulls are trying to engineer some sort of advance. Since the February 3, 2023 high of 0.8978, EURGBP has been on a steady downward path with the equivalent trendline repeatedly proving to be a very significant resistance point. In addition, the bulls would potentially have to encounter a questionable and very complex head-and-shoulders pattern. In the meantime, the momentum indicators side mostly with the bears. The Average Directional Movement Index [..]

Technical Analysis – USDJPY smashes through heavy resistance

Posted on September 6, 2023 at 7:29 am GMT

USDJPY finally snapped the 146.40 bar after a three week-long battle, stretching its uptrend towards the 147.70 constraining area for the first time since November 2022. Notably, this is where the pair peaked in 1998. Despite Tuesday’s quick bounce in the price, the MACD could not climb above its red signal line. On the other hand, the RSI is hovering comfortably above its 50 neutral mark, while the stochastic oscillator has resumed its positive slope, witnessing persisting buying interest. The upward-sloping exponential moving [..]

Technical Analysis – NZDUSD extends retreat to fresh 2023 low

Posted on September 6, 2023 at 7:25 am GMT

NZDUSD has been stuck in a steep downtrend after posting a fresh five-month high of 0.6410 in mid-July. Despite trading flat for the past two weeks, the pair dropped to a fresh nine-month bottom of 0.5858 in yesterday’s session before paring back some losses. The momentum indicators are heavily tilted to the bearish side. The RSI is hovering near its 30-oversold mark, while the stochastic oscillator is also negatively charged near its 20-oversold territory. Should the downward spike extend, the price [..]

post-image

Technical Analysis – EURCHF bulls might soon have the chance for a short-term rally

Posted on September 5, 2023 at 11:33 am GMT

EURCHF is testing its 2023 lows again, trading a tad below the August 23, 2022 low. It has been a one-way street since the January 13, 2023 high of 1.0096 as the bulls have repeatedly failed to negate the acute bearish pressure. The bulls could take some solace in the probable formation of a bullish double bottom pattern and the possible subsequent break of the 0.9647 neckline. In the meantime, the momentum indicators appear mixed at this stage. More specifically, the Average Directional [..]

Technical Analysis – GBPUSD downtrend could stay in play

Posted on September 5, 2023 at 10:11 am GMT

GBPUSD returned to the red zone on Tuesday, plunging to a new two-and-a-half-month low of 1.2527 after Monday’s bullish efforts evaporated immediately near the 1.2625 constraining area. The trend has been negative since July and the bearish crossing of the 20- and 50-day SMAs is causing concern for the near future. Moreover, the technical indicators are pointing to a continuous decline as the RSI has reversed course back to the downside below its 50 neutral mark, and the MACD has [..]

Technical Analysis – EURJPY rebounds from 50-day SMA

Posted on September 5, 2023 at 7:49 am GMT

EURJPY has been in a prolonged uptrend since the beginning of the year, posting a fresh 15-year peak of 159.75 on August 31. Although the pair experienced a pullback following its multi-year high, it managed to find its footing at the 50-day simple moving average (SMA) and recoup some losses. The momentum indicators currently suggest that bullish forces are holding the upper hand. Specifically, the RSI is hovering above its 50-neutral mark, while the stochastic oscillator is set to post a [..]

Risk Warning: Your capital is at risk. Leveraged products may not be suitable for everyone. Please consider our Risk Disclosure.