XM does not provide services to residents of the United States of America.

Technical Analysis

Technical Analysis – US 100 cash index is lower again today; sell-off could have legs

Posted on September 21, 2023 at 9:06 am GMT

The US 100 index is edging lower today, testing the support of the 100-day SMA Bears are trying to recover part of their significant losses since the March 2023 lows The pullback could continue according to the momentum indicators Recent market events have changed the sentiment in the US 100 cash index and the bears appear to have the upper hand at this juncture. The index is recording its third consecutive red candle as the bears are probably aiming to achieve [..]

post-image

Technical Analysis – BTCUSD rebound tested by 50-day SMA

Posted on September 21, 2023 at 8:34 am GMT

BTCUSD remains perky after bouncing off 25,000 support But 50-SMA proving to be a difficult obstacle to overcome Can Bitcoin maintain its recovery? BTCUSD (Bitcoin) has extended its rebound from the September 11 low of 24,920. However, the upside pressure has started to wane after coming into contact with its 50-day simple moving average. The momentum indicators are in the bullish zone but are pointing to some deterioration in the positive bias in the near term. The RSI has started [..]

Technical Analysis – AUDUSD edges lower, bearish sentiment lingers

Posted on September 21, 2023 at 6:50 am GMT

AUDUSD is edging lower today, reacting to yesterday’s key event The pair remains very close to the new 2023 low registered on September 6 The momentum indicators appear to support the downleg at this juncture AUDUSD is experiencing its second straight red candle, canceling out most of the upleg recorded since the September 6 low. The overall sentiment remains bearish despite the aggressive sell-off that took place after the formation of the double top pattern in July. Therefore, all eyes are on [..]

post-image

Technical Analysis – USDJPY struggles to break past 148.00 despite bullish momentum

Posted on September 20, 2023 at 10:08 am GMT

148.00 barrier proving difficult to overcome Still plenty of upside to achieve a break higher But bullish bias is showing signs of abating USDJPY has been knocking on the door of the 148.00 handle for the past couple of weeks but to no avail. It’s made somewhat more progress today, crawling slightly above that level. However, whilst the technical indicators remain positive, momentum does appear to be easing. The stochastic oscillator has flatlined inside the overbought region, suggesting a possible [..]

post-image

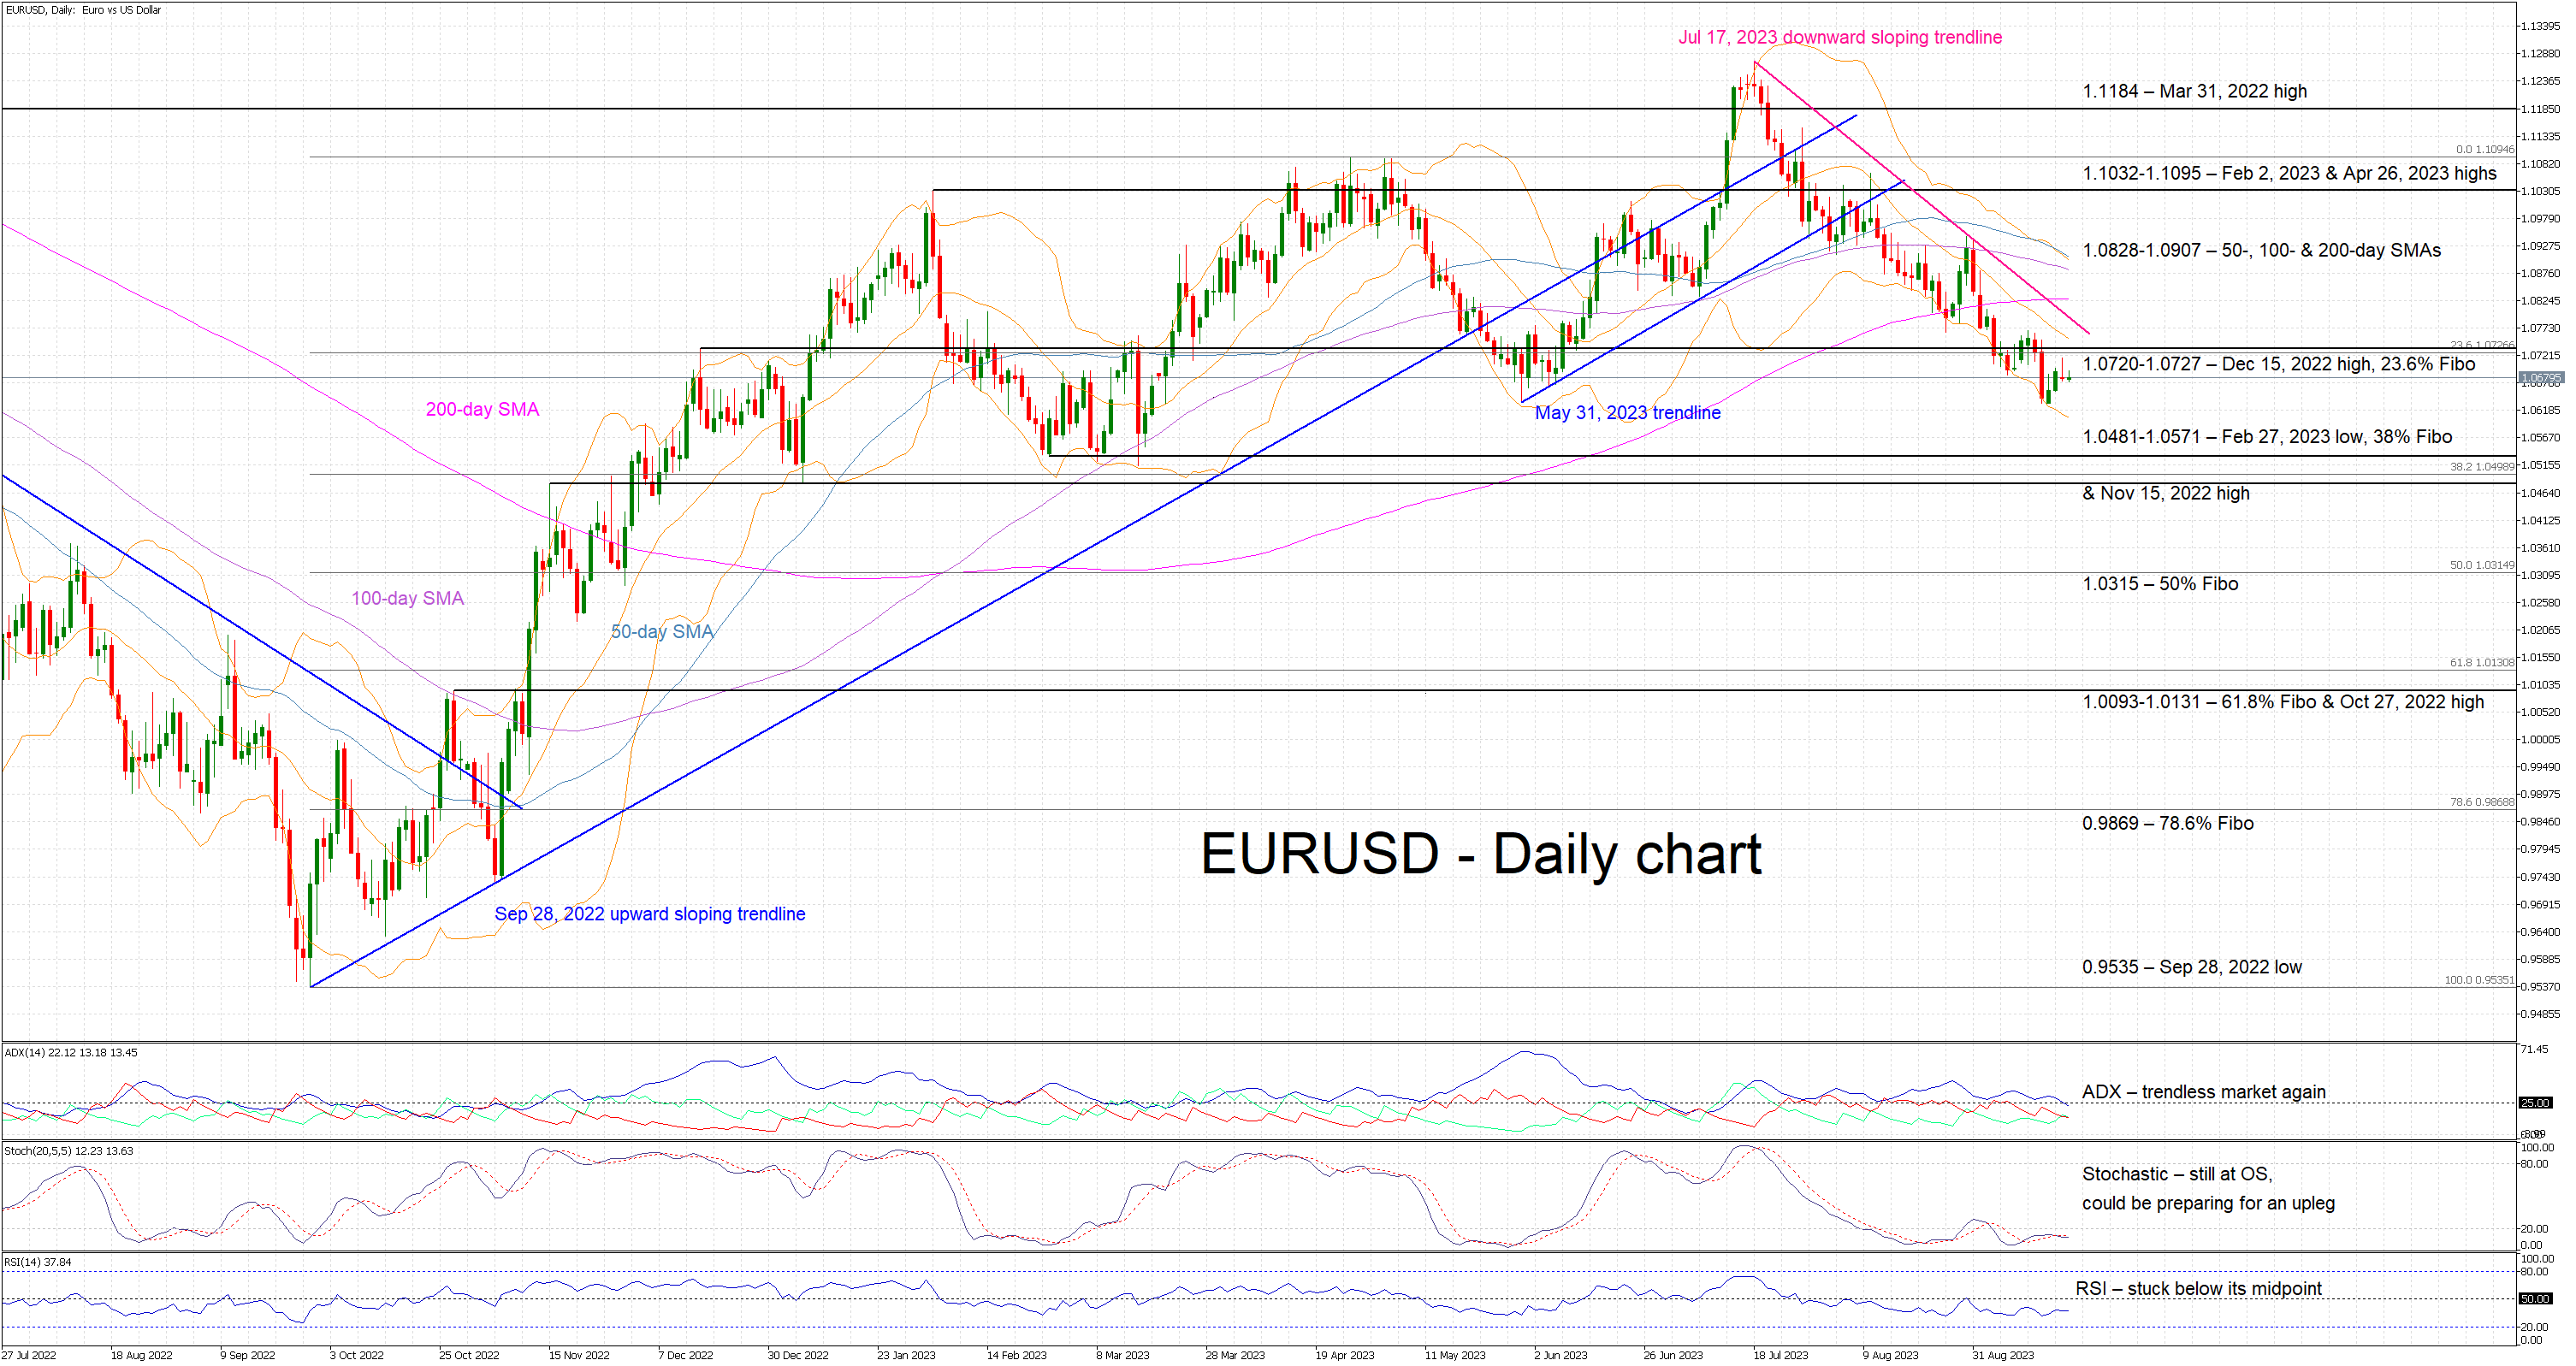
Technical Analysis – EURUSD edges higher, all eyes on the Fed meeting

Posted on September 20, 2023 at 7:14 am GMT

EURUSD continues to exhibit low volatility ahead of today’s Fed meeting It tested the May 31 low and bounced higher but remains below the 1.0720 level Bearish sentiment lingers but the SMAs’ convergence points to an imminent strong move EURUSD is hovering below the 1.0720-1.0727 area as market participants are preparing for today’s significant Fed meeting. Its outcome and the overall tone of the accompanying press conference could determine the next leg in EURUSD. The bears are still in control [..]

Technical Analysis – NZDUSD attempts to break above 61.8% Fibonacci

Posted on September 20, 2023 at 6:53 am GMT

NZDUSD halts decline at a fresh 9-month low of 0.5858 Hovers around 61.8% Fibonacci retracement of the 0.5510-0.6535 upleg in the past three weeks Positive momentum is picking up, increasing odds for an upside violation of the recent range NZDUSD had been stuck in a downtrend after posting a five-month high of 0.6410 in mid-July, which resulted in a fresh nine-month low on September 5. Since then, the pair has been consolidating around the 61.8% Fibo of 0.5902, with the momentum indicators [..]

post-image

Technical Analysis – CHFJPY confined to tight range as positive momentum wanes

Posted on September 19, 2023 at 2:50 pm GMT

CHFJPY consolidates after reaching all-time high Short-term bias looks neutral But downside risk if 50-day SMA doesn’t provide support CHFJPY has been drifting somewhat lower during September as the year-to-date uptrend lost its steam after reaching an all-time high of 166.57 on August 30. The short-term picture is neutral as the RSI has flatlined just below the 50-mark and the MACD is close to turning zero below its red signal line. The price action has been stuck in a very [..]

post-image

Technical Analysis – Silver remains stuck inside triangle pattern

Posted on September 19, 2023 at 1:44 pm GMT

Silver trades between trendlines that form a triangle Outlook is neutral, moving averages have flattened Break on either side of triangle will reveal next big move Silver prices continue to trade within a symmetrical triangle pattern, formed by a longer-term uptrend line drawn from the lows of September 2022 and a downtrend line connecting the peaks of May. Hence, the picture seems neutral for now. A break on either side of the triangle is required to signal the next directional [..]

Technical Analysis – EURJPY stabilises a tad below 15-year highs

Posted on September 19, 2023 at 9:27 am GMT

EURJPY stuck in a tight range during September Hovers just below 15-year peaks supported by 50-day SMA Momentum indicators tilt to the bullish side EURJPY has been in a prolonged uptrend since the beginning of the year, posting a fresh 15-year peak of 159.75 on August 31. Since then, the price has been trading without a clear direction around the 158.00 handle, while the short-term oscillators are reflecting a neutral-to-positive near-term bias. If the sideways pattern breaks to the upside, the [..]

Technical Analysis – GBPUSD drops to fresh 3-month low

Posted on September 19, 2023 at 6:56 am GMT

GBPUSD in a steady decline since mid-July Records consecutive multi-month lows and falls below the 200-day SMA Given that momentum indicators approach oversold conditions, can the price bounce back? GBPUSD has been forming a structure of lower highs and lower lows since its 15-month peak of 1.3141. Meanwhile, the RSI is touching its 30-oversold mark and the stochastic oscillator is within its 20-oversold territory, both suggesting that the recent decline might be overstretched. Should the bulls re-emerge and push the price higher, [..]

Risk Warning: Your capital is at risk. Leveraged products may not be suitable for everyone. Please consider our Risk Disclosure.