XM does not provide services to residents of the United States of America.

Technical Analysis

Technical Analysis – GBPJPY consolidates after pullback pauses

Posted on September 29, 2023 at 7:36 am GMT

GBPJPY slid below 50-day SMA last week after BoE’s unexpected decision to hold rates steady Found its feet at the lower end of the Ichimoku cloud and has been directionless since then Are the bulls ready to re-take charge? GBPJPY had been stuck in a prolonged uptrend since January, posting an eight-year high of 186.75 on August 22. However, the pair has been experiencing a downside correction in the past month which has stalled for now as the short-term oscillators currently suggest [..]

post-image

Technical Analysis – ETHUSD extends sideways pattern, 50-day SMA in sight

Posted on September 28, 2023 at 2:23 pm GMT

Ethereum has been in a consolidation phase for the past month Death cross between 50- and 200-day SMAs fails to induce downside pressures Momentum indicators suggest intensifying buying interest ETHUSD (Ethereum) experienced a strong pullback after peaking at 2,030 in mid-July, touching a six-month low of 1,513. Meanwhile, the digital asset has been directionless for the past month, with the price closing the gap with the declining 50-day simple moving average (SMA). Should the positive momentum strengthen, the bulls might [..]

Technical Analysis – AUDUSD still waits for support after new lows

Posted on September 28, 2023 at 8:56 am GMT

AUDUSD extends downtrend Short-term outlook is gloomy, but recovery attempts still likely Eyes on 0.6300 ahead of RBA meeting AUDUSD plunged to a new 10-month low of 0.6330 on Wednesday, putting the downtrend from July back into play ahead of RBA’s policy decision on Tuesday. The clear bearish breakout below the 2020 support trendline has further worsened the short-term outlook. Despite that, the price hasn’t deviated significantly below its September-August lows, and it’s still hovering around the lower Bollinger band. This [..]

post-image

Technical Analysis – Is the US 30 cash index bearish move losing steam?

Posted on September 28, 2023 at 8:00 am GMT

US 30 cash index experiences a strong bearish move, dropping 7% from July peak It broke below its 200-day simple moving average for the first time since March Momentum indicators are strongly bearish; all eyes on the stochastic oscillator The US 30 cash index is recording another red candle as the bears are firmly in control of the market and capitalizing on the recent double top pattern. They have managed to break the numerous simple moving averages (SMAs) employed here. [..]

Technical Analysis – WTI oil futures hit an 11-month high

Posted on September 28, 2023 at 7:01 am GMT

WTI futures climb to their highest level since August 2022 Advance shows no signs of easing so far, bulls eye crucial 100 psychological mark But RSI, stochastics and Bollinger bands point at overbought conditions WTI oil futures (November delivery) have been in a steady advance since July, climbing to an 11-month peak of 95.02 in today’s session before paring some gains. However, the momentum indicators are currently deep in their overbought territories, suggesting that the recent rally could be overstretched. Should the bulls attempt [..]

post-image

Technical Analysis – Gold tumbles below 1,900 but looks oversold

Posted on September 27, 2023 at 8:57 am GMT

Gold retreats below the 1,900 handle to its lowest level in a month Decline shows no signs of easing, while widening Bollinger bands point to high volatility Momentum indicators deep in their oversold territories, hinting at potential bounce Gold has been in a solid downtrend in the four-hour chart, violating both its 50- and 200-period simple moving averages (SMAs) and falling below the 1,900 psychological mark. However, the short-term oscillators currently suggest that the dip could be overstretched, thus a [..]

post-image

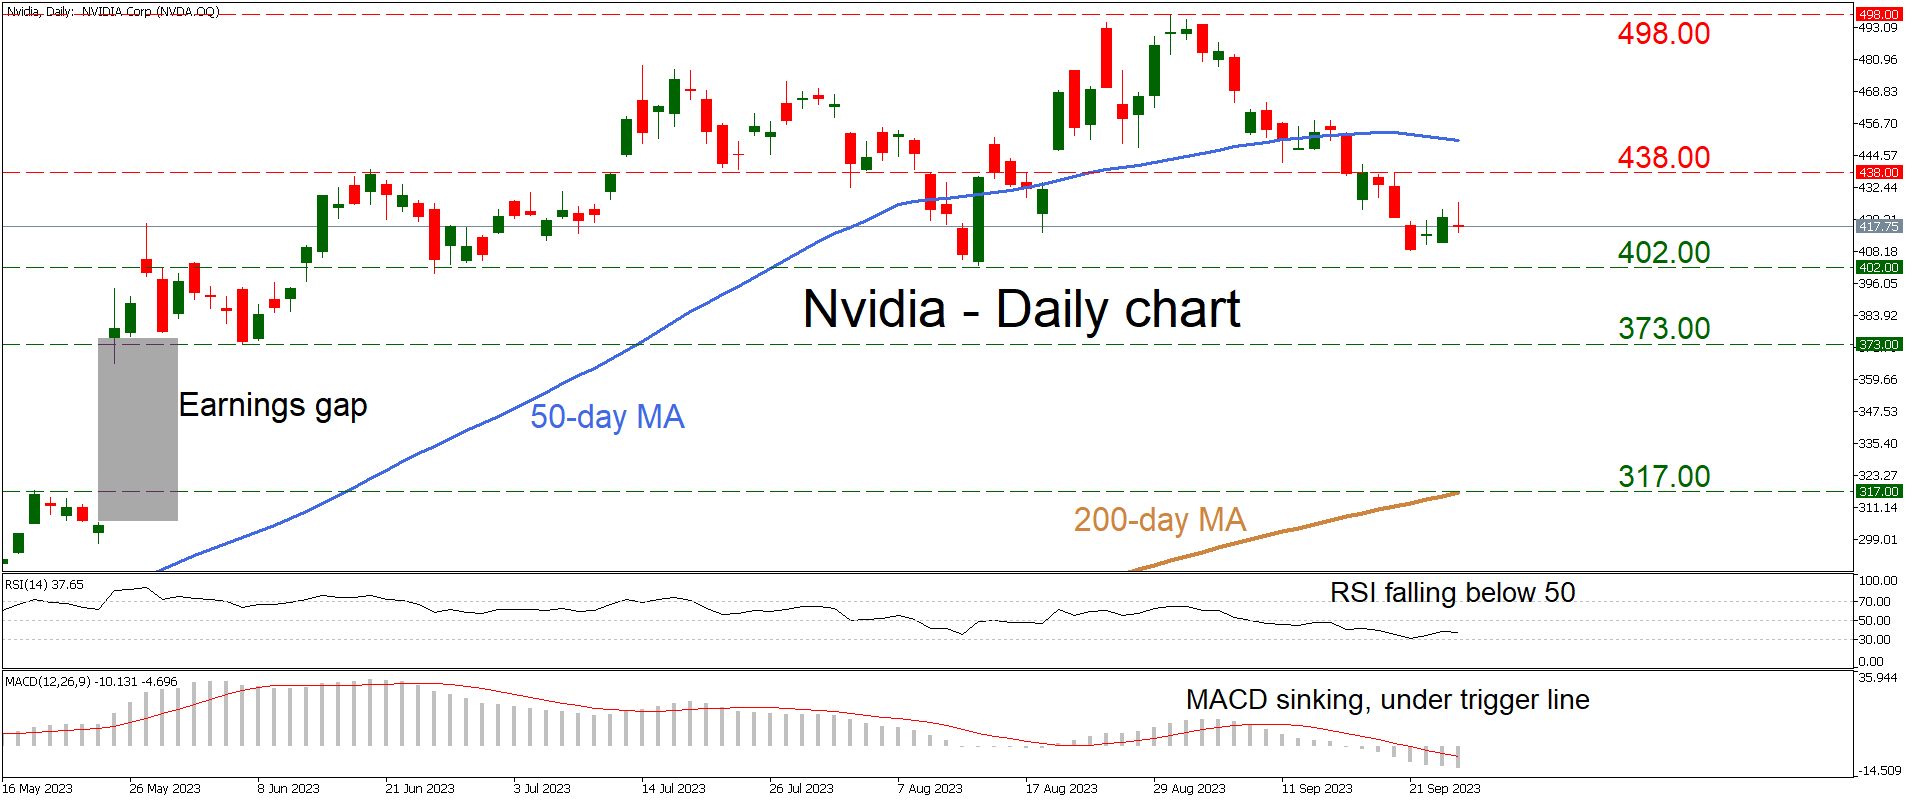
Technical Analysis – Nvidia stock retreats but remains in an uptrend, for now

Posted on September 27, 2023 at 8:31 am GMT

Nvidia stock has retreated 16% from its August record highs Uptrend remains intact, but drop under 402.00 can change that Huge earnings gap below is a clear risk if market moves lower   Nvidia shares have moved sharply lower since reaching a new record high in late August. Yet, the price structure of higher highs and higher lows has not been violated yet, which suggests that the market remains in an uptrend. That said, any declines below the crucial 402.00 [..]

Technical Analysis – Will USDJPY march higher?

Posted on September 27, 2023 at 7:49 am GMT

USDJPY marks new higher highs The current state may be close to overbought territory Bulls need a durable move above 149.00 USDJPY managed to keep a footing within a short-term ascending channel and softly rise to a one-year high of 149.17 on Tuesday. That said, the price momentum remains weak and the RSI and the stochastic oscillator are already flirting with overbought levels, suggesting that buyers might soon exercise caution in the market. Nevertheless, if the price holds above the channel’s support trendline [..]

Technical Analysis – Has the recent sell-off in NZDUSD run its course?

Posted on September 27, 2023 at 7:40 am GMT

NZDUSD continues to hover around the 0.5920 level Last week’s key events did not result in a new trend in NZDUSD The momentum indicators have taken a back seat at this stage NZDUSD is trading lower, testing the support set by the May 15, 2022 low of 0.5920. The bears have managed to stop the recent series of six consecutive green candles, but they have failed, up to now, to register a significant sell-off. Similarly, the momentum indicators are trying [..]

post-image

Technical Analysis – Tesla stock drops below 50-day SMA

Posted on September 26, 2023 at 3:01 pm GMT

Tesla stock experiences a pullback from September high Dipped beneath its 50-day SMA before recouping some losses Further declines could send the price to test the crucial ascending trendline Tesla’s stock has been undergoing a solid downside correction after peaking at the 278.00 region in mid-September. Despite yesterday’s green candle, the short-term indicators are pointing to more losses in the near-term as the MACD is below the red signal line and the RSI is hovering in its bearish territory.   [..]

Risk Warning: Your capital is at risk. Leveraged products may not be suitable for everyone. Please consider our Risk Disclosure.