XM does not provide services to residents of the United States of America.

Technical Analysis

post-image

Technical Analysis – EURCHF keeps rising above negative channel

Posted on November 13, 2023 at 1:53 pm GMT

EURCHF surges to a 1-month high Momentum indicators suggest more bullish movement EURCHF is probably set for another bullish wave as the price is jumping above the 0.9650 significant resistance and the five-month bearish channel. The pair recorded a new one-month high of 0.9660 earlier today. The 20- and the 50-day simple moving averages (SMAs) are ready for a positive crossover in the next few sessions with the technical oscillators showing some encouraging signs too. The RSI is still developing above the [..]

post-image

Technical Analysis – Is it time for a bearish reaction in EURGBP?

Posted on November 13, 2023 at 12:49 pm GMT

EURGBP edges lower today, a tad above 0.8720 It continues to respect the August 23, 2023 trendline Momentum indicators remain mostly bullish EURGBP is trading a tad above 0.8720 and registering its first red candle after five consecutive green candles. It bounced off the August 23, 2023 ascending trendline last week with the bulls aiming to record a new high, keeping the bullish structure of higher highs and higher lows alive and recouping another part of the losses they incurred [..]

Weekly Technical Outlook – EURUSD, GBPUSD, AUDUSD

Posted on November 13, 2023 at 11:09 am GMT

EURUSD stays above key barrier of 1.0665 ahead of US CPIs Hotter-than-expected UK inflation could push GBPUSD above 1.2310 AUDUSD awaits Australia’s jobs report and Chinese data US CPI data -> EUR/USD The US CPI data comes out on Tuesday and expectations are for the headline rate to have declined to 3.3% y/y from 3.7%, while the core rate is expected to have remained close to September’s 4.1%. That said, considering that the PMIs for October suggested softer price pressures, [..]

Technical Analysis – Gold tumbles but 200-day SMA curbs decline

Posted on November 13, 2023 at 9:47 am GMT

Gold extends its fall from the 5-month peak of 2,009 Hits the crucial 200-day SMA, which holds strong for now Momentum indicators slowly tilt to the bearish side Gold had been in a steep uptrend since October 10 mainly on the back of geopolitical tensions, reclaiming crucial technical regions and posting a fresh five-month peak of 2,009. However, bullion has been experiencing a solid downside correction since then, with short-term oscillators pointing at more pain ahead. Should gold resume its freefall, the bears could [..]

post-image

Technical Analysis – Gold turns lower again

Posted on November 10, 2023 at 10:39 am GMT

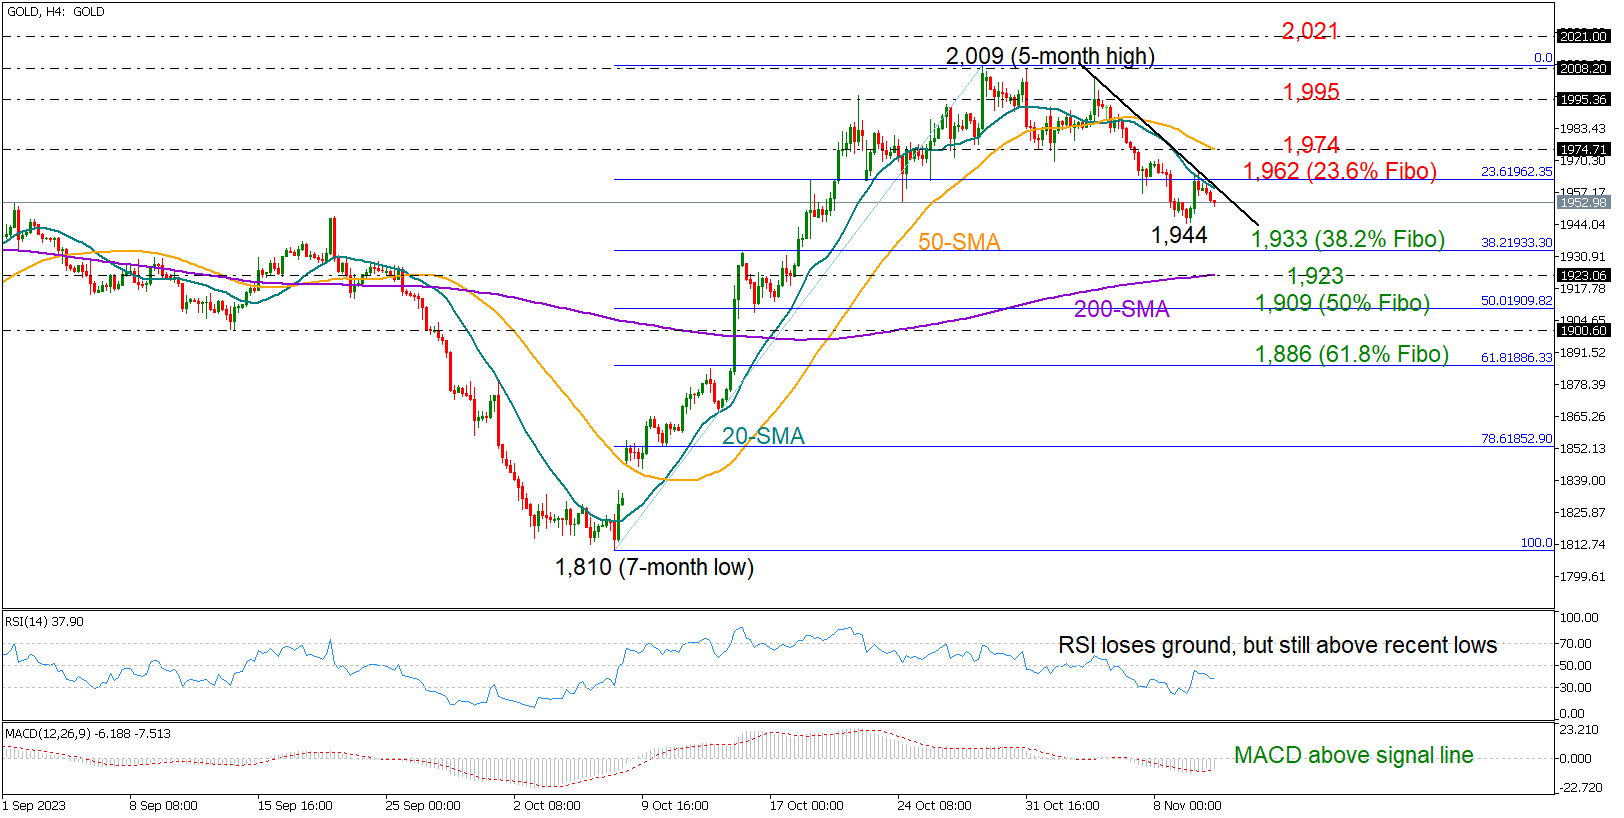
Gold stalls recovery; cannot surpass 20-SMA Sentiment weakens, but the bulls might have another chance   Gold rebounded from a three-week low of 1,944 on Thursday, but the recovery was immediately stopped by the 20-period SMA on the four-hour chart at 1,962. The 23.6% Fibonacci retracement of the previous uptrend cemented that ceiling, forcing the price to move lower. The latest negative reversal in the RSI is discouraging, but the indicator is still in an upward move since bottoming out [..]

post-image

Technical Analysis – EURAUD higher; tests key trendline

Posted on November 10, 2023 at 10:18 am GMT

EURUSD is higher again today, tests key descending trendline Convergence of simple moving averages (SMAs) points to an imminent move Momentum indicators are not extremely excited by the current rally EURAUD is moving higher again today, recording its fifth consecutive green candle after bouncing off the June 15, 2023 upward sloping trendline. It is currently testing the resistance set by the August 17, 2023 descending trendline as the bulls are trying to record a higher high and cancel out the [..]

Technical Analysis – GBPJPY consolidates near 2-month highs

Posted on November 10, 2023 at 9:38 am GMT

GBPJPY advanced to its highest since late August Trades sideways after failing to extend its breakout RSI and MACD are hovering in their positive regions GBPJPY had been in a prolonged uptrend since January, posting an eight-year high of 186.75 on August 22 before experiencing a pullback. After a period of rangebound trading, the pair stormed back above the 50-day simple moving average (SMA) to a two-month peak of 185.94, but its rally seems to have temporarily paused. Considering that the short-term [..]

Technical Analysis – USDCAD tests 1.3800 tricky area

Posted on November 10, 2023 at 8:26 am GMT

USDCAD marks positive week, but slows pace near 1.3800 Short-term bias skewed to the upside, but caution needed   USDCAD has been in a bullish corrective mode during the week, retracing some of its losses from November’s one-year high of 1.3898. Entering the 1.3800 area has been a struggle over the past two days, and there might be another tough obstacle within the 1.3840-1.3870 region, but the bulls may not give the battle yet, according to the technical indicators. Specifically, [..]

post-image

Technical Analysis – JP 225 index holds above crucial trendline

Posted on November 9, 2023 at 3:53 pm GMT

JP 225 index trades sideways after strong advance pauses Remains supported by the 50-day SMA and descending trendline Momentum indicators suggest more gains in the near term The JP 225 index (cash) stormed higher after validating a double bottom pattern around the 30,400 region in late October. Although the price jumped to its highest level since September 20, it has been rangebound since then appearing unable to extend its advance. If the bullish pressures persist, the price could revisit its recent resistance of [..]

post-image

Technical Analysis – Silver prices edge lower, trapped under trendline

Posted on November 9, 2023 at 2:18 pm GMT

Silver remains in a downtrend, after recovery runs out of fuel Prices trading below trendline and key moving averages  Break above 23.60 or below 22.20 could signal next move Silver prices remain trapped in a downtrend, with a clear structure of lower highs and lower lows in place since May. The market is also trading below a trendline drawn from the May peak, as well as below the 50- and 200-day simple moving averages (SMAs), all of which suggests that [..]

Risk Warning: Your capital is at risk. Leveraged products may not be suitable for everyone. Please consider our Risk Disclosure.