XM does not provide services to residents of the United States of America.

Technical Analysis

Technical Analysis – USDJPY’s 2023 performance is positive

Posted on December 7, 2023 at 8:30 am GMT

USDJPY remains above uptrend line Bearish correction may be on the cards RSI and stochastic indicate negative move USDJPY has been in ascending movement since the beginning of 2023, but now is creating the fourth consecutive red week after the pullback off the 13-month high of 151.90. Technically, the bulls might still be in the town as the market is developing above the long-term uptrend line. However, the technical indicators are suggesting a bearish correction, mirroring the latest downward move [..]

post-image

Technical Analysis – GBPUSD ends 2023 in bullish area

Posted on December 6, 2023 at 9:50 am GMT

GBPUSD finds strong resistance near 200-week EMA Technical signals are negative Will 2024 be a negative year for the pair? With the year 2023 drawing to a close, GBPUSD could not carry the impressive rally of the last three weeks above the bullish crossover within the 50- and the 100-week simple moving averages (SMAs) and the 23.6% Fibonacci retracement level of the upward wave from 1.0325 to 1.3140 at 1.2480. Also, the pair found strong resistance near the 200-week exponential moving average (EMA), sending prices lower this [..]

Technical Analysis – USDCAD slows down before BoC rate decision

Posted on December 6, 2023 at 9:30 am GMT

USDCAD halts near last week’s limits Bias remains skewed to the downside BoC policy announcement awaited   USDCAD opened with mild losses on Wednesday after Tuesday’s remarkable rally stalled near last week’s resistance of 1.3593. Traders were also in a wait-and-see mode ahead of the Bank of Canada’s rate decision at 15:00 GMT. The 1.3593 bar overlaps with the 38.2% Fibonacci retracement of the July-October uptrend, making a pullback likely. Yet, the RSI has yet to crawl above its 50 [..]

Technical Analysis – Can NZDUSD bulls keep the rally alive?

Posted on December 6, 2023 at 7:35 am GMT

NZDUSD in the green today but sentiment mixed Key market events increase possibility of stronger moves Momentum indicators on the brink of giving bearish signals NZDUSD is edging higher today, reacting to the previous two sizeable red candles. It has been an aggressive rally from the November 1 low of 0.5788 as NZDUSD bulls took advantage of the widespread USD weakness and the relative hawkishness of the RBNZ to record a 3-month high of 0.6222. In the meantime, the convergence [..]

post-image

Technical Analysis – Gold holds slightly below crucial trendline

Posted on December 6, 2023 at 7:30 am GMT

Gold recoups some losses of the preceding days Very short-term bias skewed to the upside, but caution needed Gold prices are recovering somewhat after the aggressive selling interest that was posted in the preceding two days. The yellow metal skyrocketed to a fresh record high of 2,145 on Monday but it failed to continue the upside rally and fell back near the 2,000 round number.   According to the technical indicators, the RSI is ticking marginally higher in the negative [..]

post-image

Technical Analysis – Nvidia stock pulls back towards 50-day SMA

Posted on December 5, 2023 at 3:52 pm GMT

Nvidia in a steady decline since its record high In November But the 50-day SMA curbs the retreat for now Momentum indicators are turning negative Nvidia has been the best performing stock of the S&P 500 in 2023, storming to a fresh record peak of 505.00 on November 20. Although the price has been experiencing a downside correction since then, the 50-day simple moving average (SMA) seems to be acting as a strong floor in the near term. Given that the short-term [..]

post-image

Technical Analysis – Palladium futures return to multi-year lows

Posted on December 5, 2023 at 2:07 pm GMT

Palladium futures at risk of broad bearish trend resumption Oversold signals detected, eyes on the 945 floor   Palladium futures (March delivery) confirmed a bearish double top pattern near the 200-period simple moving average (SMA) in the four-hour chart after the slump below the 1,045 neckline last week. The price slid as low as 961 on Monday, bringing November’s five-year low of 945 on the radar again. Note that RSI has crossed below its 20 oversold level, suggesting that selling appetite could [..]

post-image

Technical Analysis – ETHUSD posts a fresh 18-month high

Posted on December 5, 2023 at 12:24 pm GMT

Ethereum jumps to its highest since May 2022 Advance eases as oscillators point at overbought conditions ETHUSD (Ethereum) has experienced a strong rally since late October, which propelled the price to a fresh 18-month peak of 2,274 on Monday. However, the uptrend seems to be losing some steam, with both the RSI and stochastics touching their overbought territories. Should the rally extend, the price could initially test the February 2022 support of 2,300, which could now serve as resistance. Conquering this [..]

post-image

Technical Analysis – AUDUSD plummets below uptrend line

Posted on December 5, 2023 at 10:20 am GMT

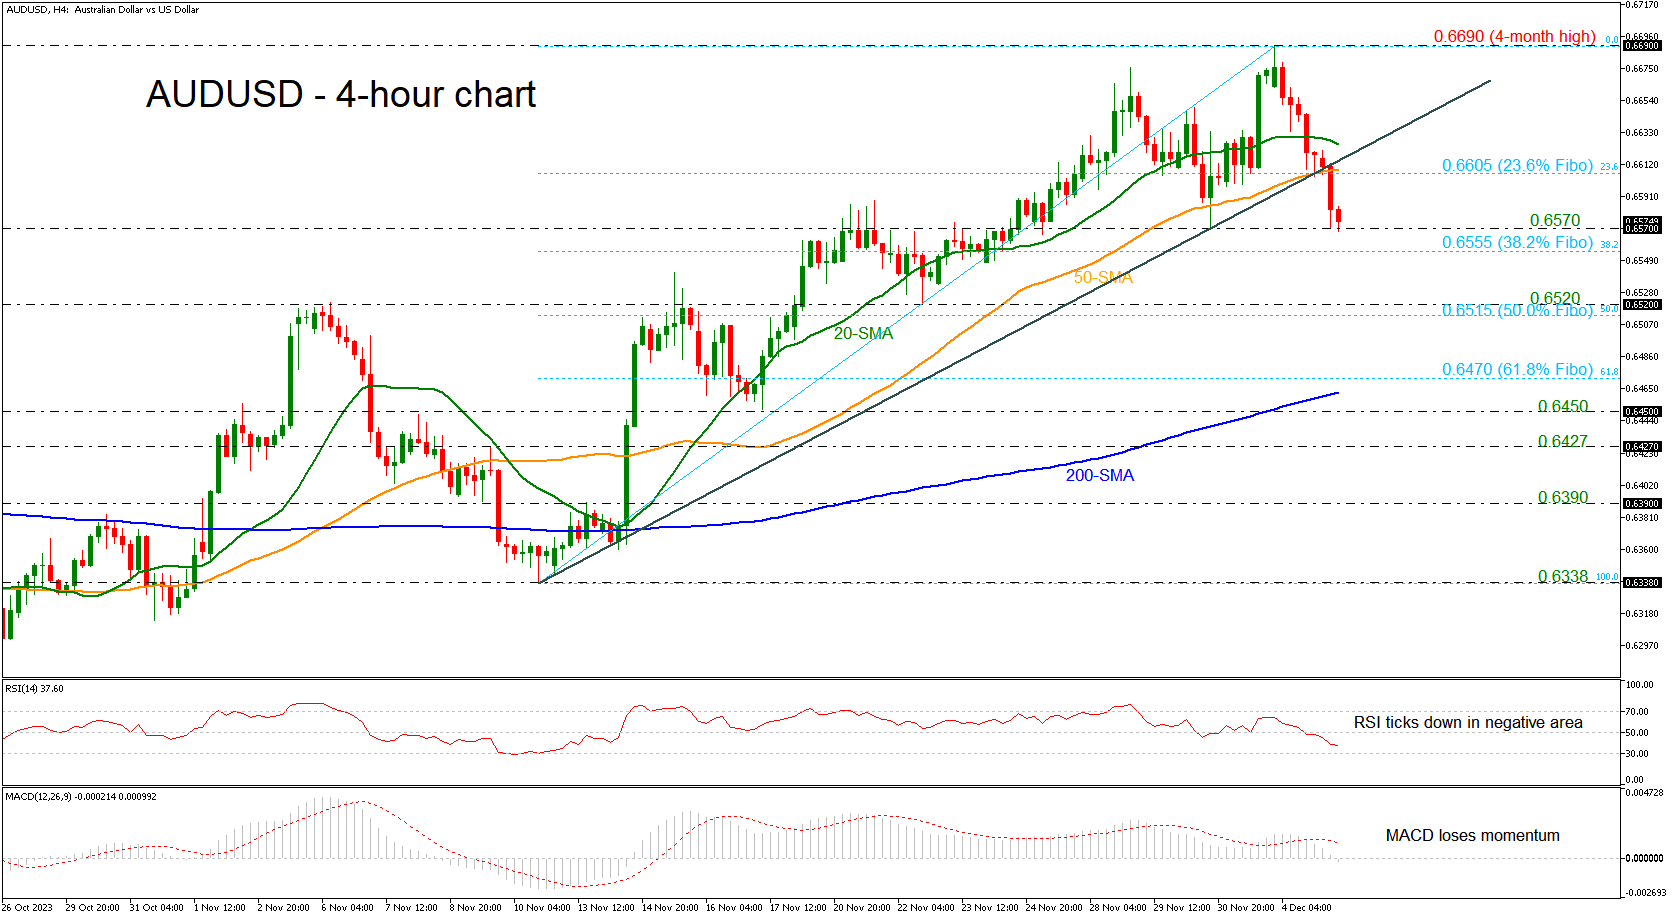
AUDUSD posts several red candles Holds below the SMAs Technical oscillators hold in negative areas AUDUSD has been in a bearish corrective mode during the week, penetrating the short-term uptrend line to the downside with strong momentum. Entering the 0.6570 area has been a struggle over the past three days, and there might be another tough obstacle within the 38.2% Fibonacci retracement level of the up leg from 0.6338 to 0.6690 at 0.6555, but the bears may not give the [..]

Technical Analysis – GBPUSD bulls hit a wall; support nearby

Posted on December 5, 2023 at 9:18 am GMT

GBPUSD reaches overbought area near key resistance Sellers could take control of the market below 1.2588   GBPUSD flatlined around the familiar 1.2720 resistance region, which was last tested at the end of August, after three constructive bullish weeks. The area also overlaps with the 61.8% Fibonacci retracement of the July-October downleg. The ongoing consolidation phase could develop into a bearish wave according to the technical indicators. Both the RSI and the stochastic oscillators have peaked near their overbought levels and [..]

Risk Warning: Your capital is at risk. Leveraged products may not be suitable for everyone. Please consider our Risk Disclosure.