XM does not provide services to residents of the United States of America.

Technical Analysis

post-image

Technical Analysis – US 500 index turns lower between SMAs

Posted on May 27, 2019 at 1:31 pm GMT

The US 500 stock index has declined considerably from the fresh all-time high of 2960.48, penetrating the Ichimoku cloud in the daily timeframe. The bearish correction picture in the short term is further supported by the MACD, which is falling below its red signal line and the RSI indicator which is turning slightly lower. Should prices move lower, support could come at the 23.6% Fibonacci retracement level of the upleg from 2332 to 2960.48 around 2813 again. Below that, the 2784 is another major support before [..]

post-image

Technical Analysis – GBPAUD touches uptrend line; maintains short-term bearish bias

Posted on May 27, 2019 at 11:15 am GMT

GBPAUD has touched the ascending trend line, which has been holding since December 2018, trading below the flat short-term moving averages. The RSI is moving sideways below the neutral threshold of 50, while the stochastic oscillator is moving in the oversold territory, turning even lower. If the price slips further below the 1.8305 barrier and the rising trend line, immediate support could be faced from the 38.2% Fibonacci retracement level of the upleg from 1.7220 to 1.8880 near 1.8243. Further declines [..]

Technical Analysis – Gold finds obstacle near 1,287; indicator suggest bearish bias

Posted on May 27, 2019 at 8:46 am GMT

Gold prices had another touch of the 1,287 resistance level today, remaining above the 23.6% Fibonacci retracement level of the descending movement from 1,346.60 to 1,266 near 1,285 and is standing within the Ichimoku cloud in the 4-hour chart. The RSI and the stochastic oscillator signal that the next move in the price is more likely to be on the downside as the former is negatively sloped above its 50 neutral mark and the latter continues to weaken slowly in the overbought zone, recording [..]

Technical Analysis – EURUSD flies near 40-SMA after rebound on 2-year low

Posted on May 27, 2019 at 6:32 am GMT

EURUSD is flirting with the 40-day simple moving average (SMA) today, after the aggressive rebound on the two-year low of 1.1106, achieved last Thursday. Currently, the pair has been developing within a narrow range of 1.1110 – 1.1260 as it failed several times to break from these obstacles. The technical structure suggests further upside movement as the MACD surpassed the trigger line and is moving towards the zero line, while the stochastic oscillator entered the overbought zone. Should the price [..]

post-image

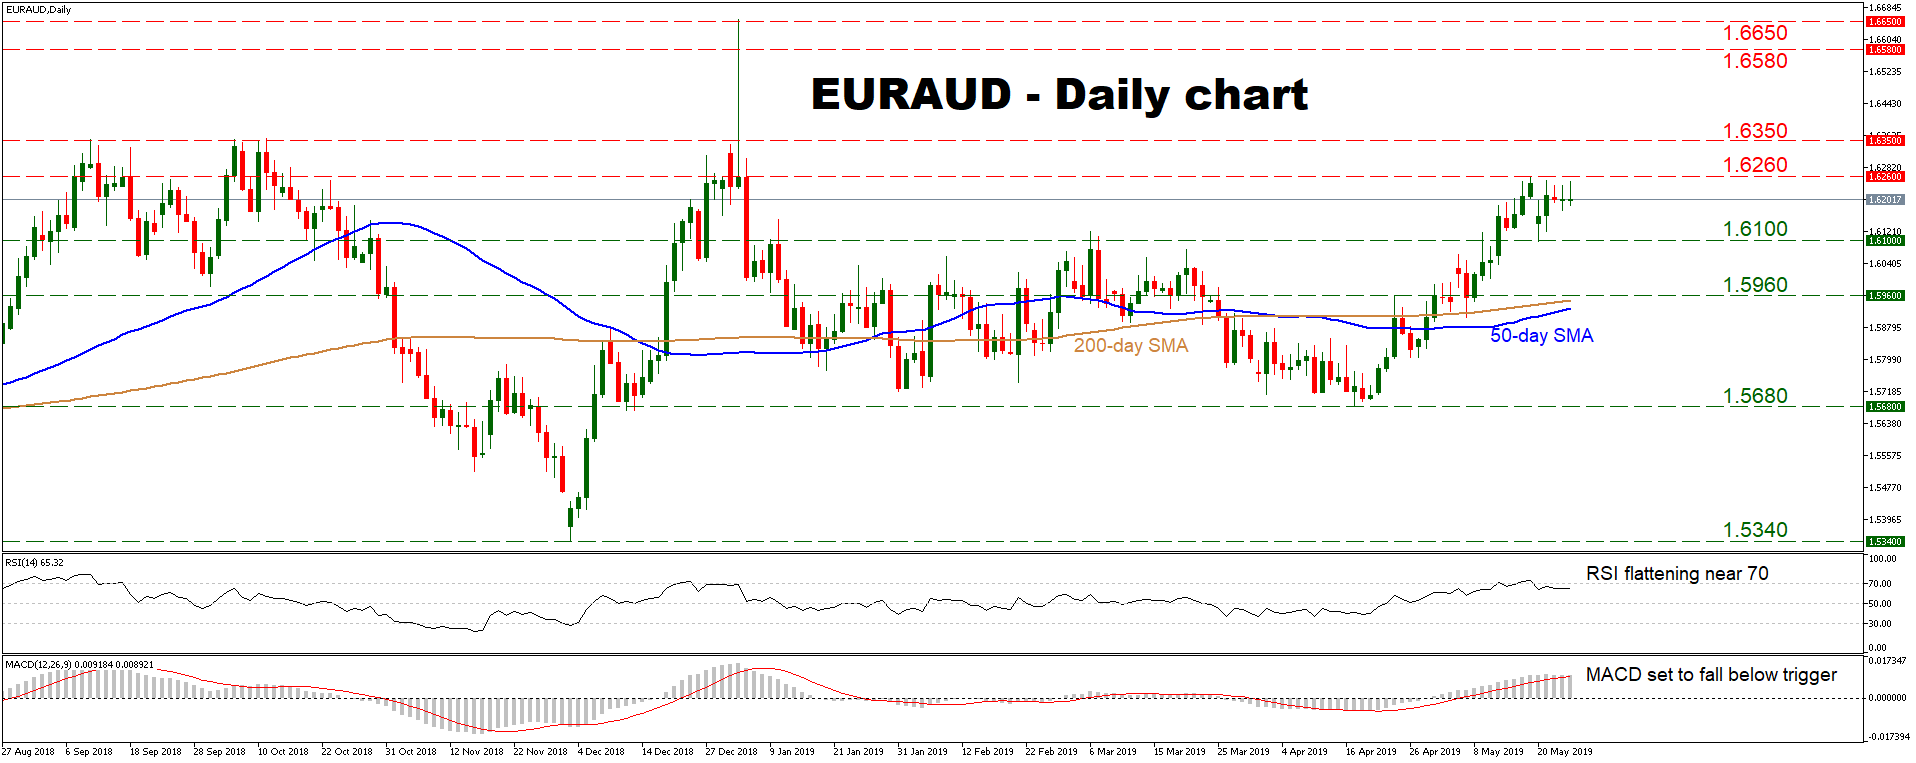
Technical Analysis – EURAUD positive in near term, neutral in medium run

Posted on May 24, 2019 at 12:34 pm GMT

EURAUD recorded decent gains in the past month, crossing above its 50- and 200-day simple moving averages (SMAs) to touch 1.6260, a high last seen in January. The short-term picture thus seems positive, though for the medium-term outlook to turn positive too, a break above 1.6350 is required. Short-term momentum indicators, however, suggest the rally may be losing steam. The RSI seems to have flattened near its 70 zone, while the MACD appears ready to drop below its red trigger [..]

Technical Analysis – USDCAD maintains neutral-to-bullish bias above cloud

Posted on May 24, 2019 at 6:52 am GMT

USDCAD was trading not too far from yesterday’s one-week high of 1.3501 on Friday, having pulled back slightly. But momentum indicators suggest there is still some upside for the pair to advance again. The near-term bias is looking neutral-to-bullish as the RSI is flatlining above the 50-neutral level, while the stochastics are pointing north and the %K and %D lines remain positively aligned. The neutral-to-bullish picture also holds true for the medium-term outlook as the pair has been consolidating following [..]

post-image

Technical Analysis – EURGBP climbs, but more upside needed to affirm bullish outlook

Posted on May 23, 2019 at 2:11 pm GMT

EURGBP staged a mighty rally over the past weeks, crossing above its 50- and 200-day simple moving averages (SMAs) to touch the 0.8840 zone, before retreating somewhat. The near-term outlook seems to have turned positive, though a clear break above 0.8840 is needed to confirm that. Short-term momentum indicators, on the other hand, suggest a pullback may be looming. The RSI turned lower after entering its overbought zone, while the MACD seems to be topping above its trigger line. A [..]

post-image

Technical Analysis – CADJPY erases gains; remains in neutral mode

Posted on May 23, 2019 at 1:19 pm GMT

CADJPY has been finding strong resistance on the 82.60 barrier, falling beneath the 20-simple moving average (SMA) in the daily chart. Since mid-January, the pair has been trading within a narrow range between the 61.8% Fibonacci of the downleg from 89.25 to 76.60, near 84.40, and the 80.90 support. Having a look at the momentum indicators, the RSI is pointing down below the neutral threshold of 50 and the MACD is hovering near the trigger line and below the zero line. A step lower could find immediate support at [..]

post-image

Technical Analysis – Copper futures record 4-month low; bears have control

Posted on May 23, 2019 at 11:41 am GMT

Copper futures with delivery on July 2019 are falling below the 20- and 40-simple moving averages (SMAs) in the daily chart. Moreover, the technical indicators remain in bearish territory, with the RSI sloping down in oversold zone and the MACD oscillator is still endorsing the bearish view as it is weakening below its trigger line. In case the price extends the bearish move, the next immediate support is expected to come from the 2.6305 barrier.  A significant penetration of this line would drive prices lower until [..]

Technical Analysis – NZDUSD turns attention to 7-month low; strongly negative

Posted on May 23, 2019 at 8:25 am GMT

NZDUSD has been in a strong bearish rally over the last two months, reaching a fresh seven-month low of 0.6482 earlier today. What remains to be seen is if the bears have enough fuel to continue this sharp negative movement as the technical indicators are suggest the opposite. The MACD and the stochastics are ready for a bullish cross with the trigger line and within the %K and %D lines respectively in the bearish region. If the momentum oscillators prove [..]

Risk Warning: Your capital is at risk. Leveraged products may not be suitable for everyone. Please consider our Risk Disclosure.