XM does not provide services to residents of the United States of America.

Technical Analysis

post-image

Technical Analysis – USDCAD marks bullish wave in short-term

Posted on January 5, 2024 at 7:32 am GMT

USDCAD meets 20-day SMA Technical signals mixed; downtrend well intact USDCAD has been rising since the end of 2023 after the bounce off the 1.3175 support level and is currently reaching the short-term 20-day simple moving average (SMA) near 1.3373, but is still developing beneath the descending trend line. The MACD and the RSI are confirming the bullish move in the market as the first one is holding above its trigger line, and the latter is pointing marginally up near [..]

post-image

Technical Analysis – ETHUSD trades sideways after decline pauses

Posted on January 4, 2024 at 1:46 pm GMT

ETHUSD spikes aggressively to the downside Rebounds quickly and moves sideways in the last sessions Momentum indicators are heavily tilted to the downside ETHUSD (Ethereum) experienced a sharp retreat following the formation of a double top pattern in the four-hour chart. Although the bulls managed to recoup some losses after the price tumbled to a fresh one-month bottom of 2,108, the digital coin is still hovering beneath both its 50- and 200-period moving averages (SMAs). Should the sideways pattern break to the upside, [..]

post-image

Technical Analysis – EURGBP’s sell-off remains on cards

Posted on January 4, 2024 at 10:57 am GMT

EURGBP posts strong negative move RSI and MACD supports the bearish structure on price EURGBP is plummeting beneath the simple moving averages (SMAs), shifting the positive outlook to bearish in the near-term. The RSI indicator is showing some weakness, dropping beneath the neutral threshold of 50, while the MACD is falling below its trigger line and is holding near the zero level. More downside pressures could take traders towards the 0.8570 support level ahead of the significant 0.8550 barrier, which [..]

post-image

Technical Analysis – EURJPY speeds above key barrier

Posted on January 4, 2024 at 9:46 am GMT

EURJPY rises above key resistance, but more remain Technical signals show improvement   EURJPY has been in a range between its 20- and 200-day simple moving averages (SMAs) over the past month, currently pushing for a close above the former at 156.45 after failing twice to overcome it in December. The technical indicators are sending some encouraging signals. The RSI keeps trending up, and the MACD has risen above its red signal line. Moreover, the stochastic oscillator is ready to start [..]

post-image

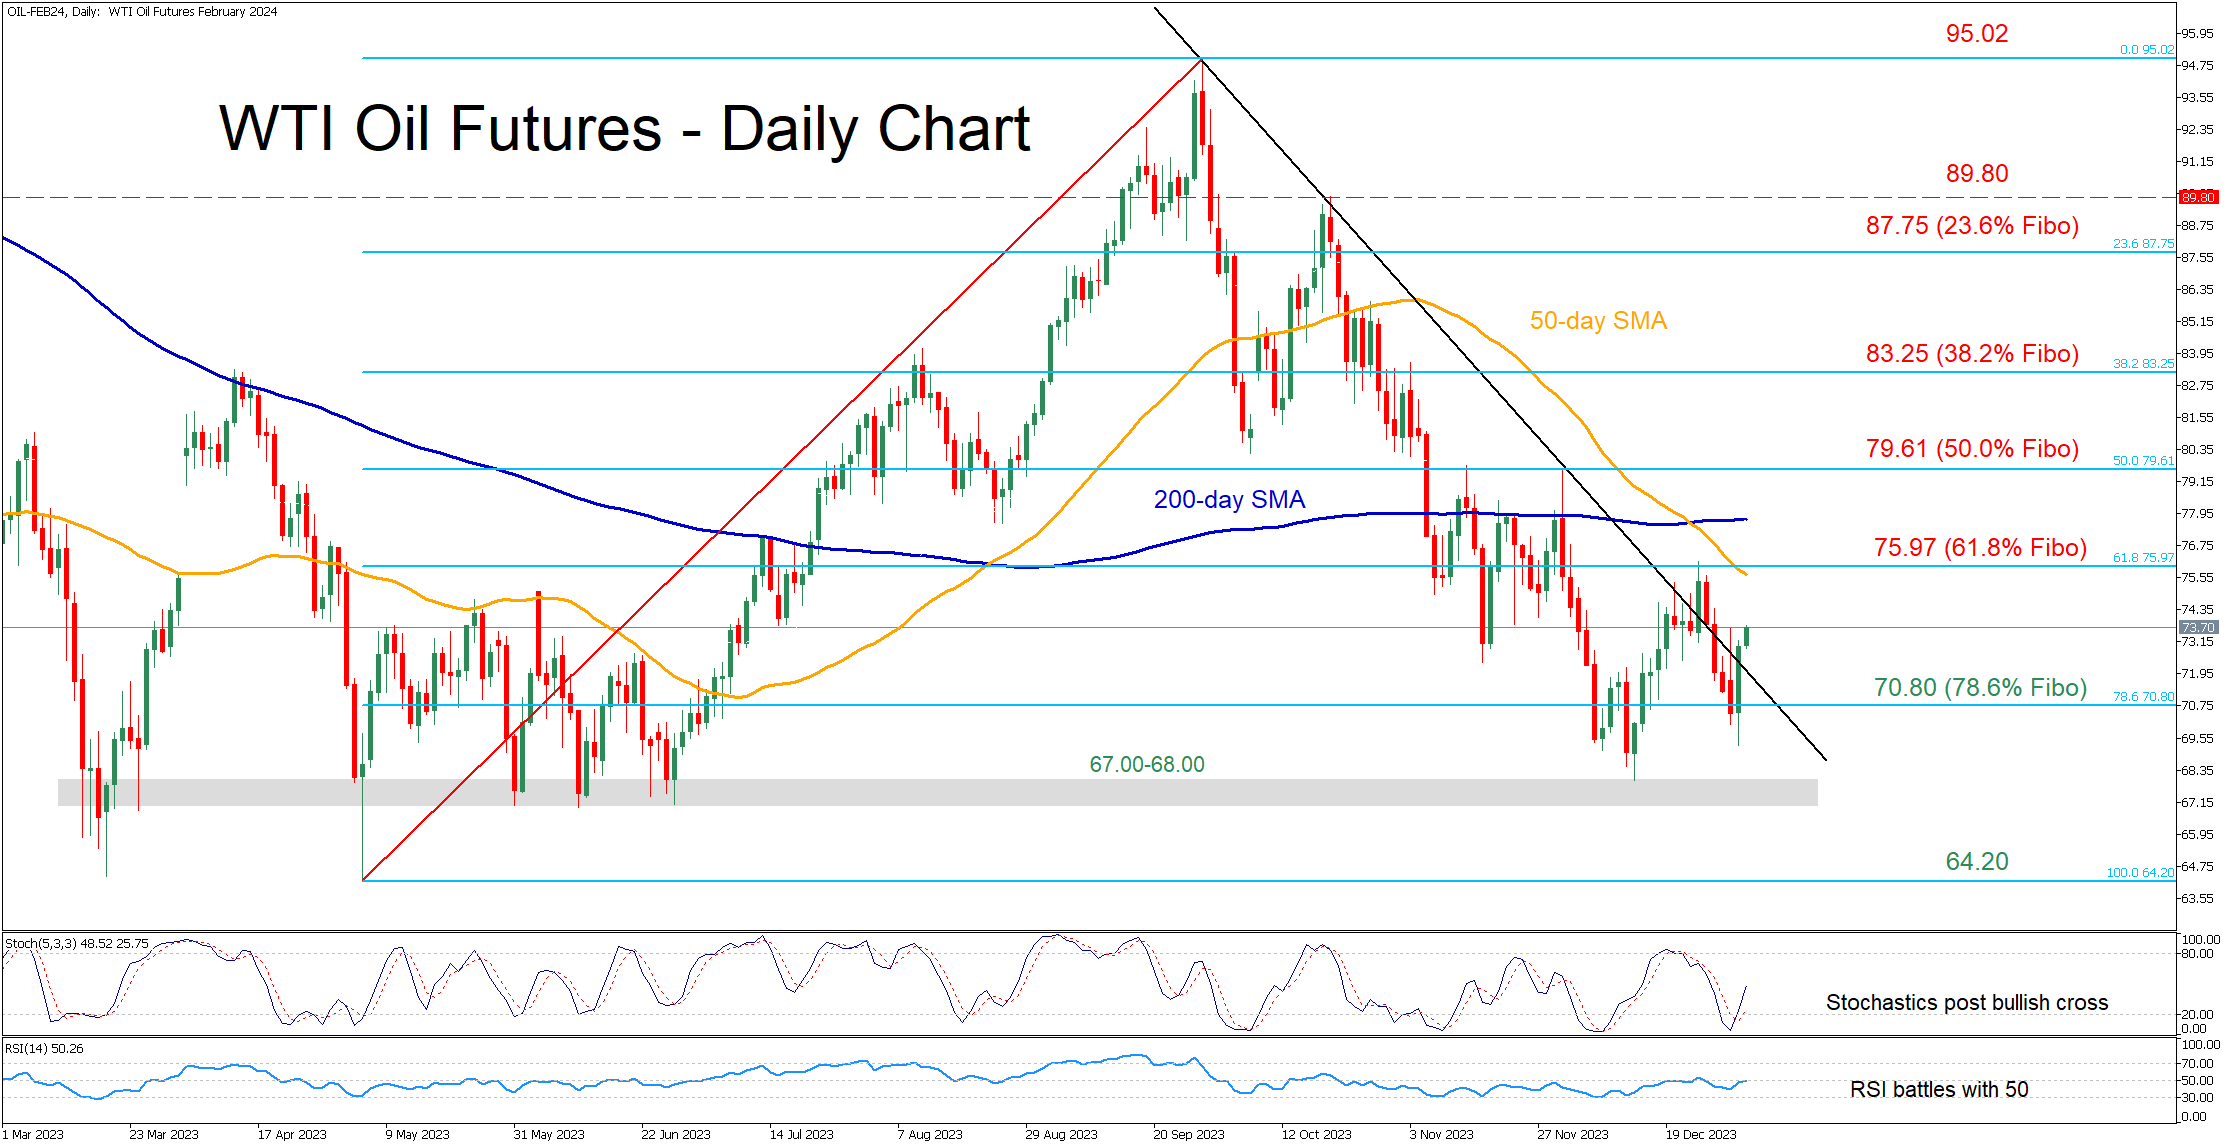
Technical Analysis – WTI oil futures battle with descending trendline

Posted on January 4, 2024 at 9:36 am GMT

WTI futures attempt to break above crucial trendline  But their advances are constantly held down  Momentum indicators suggest a cautiously positive tone WTI oil futures (February delivery) have been on the retreat since their October peak of 89.85, breaking below consecutive support zones. Although the price has been trying to recover some ground in the last few sessions, the downward sloping trendline that connects a series of lower highs since September has been acting as a strong ceiling. If the price manages to hold above [..]

post-image

Technical Analysis – US 30 cash index could be close to a correction

Posted on January 4, 2024 at 8:33 am GMT

US 30 index trades a tad below its all-time high Aggressive move higher from the October lows Stochastic oscillator could be the catalyst for a sizeable correction The US 30 cash index is in the green today as it trades a hair’s breadth away from its recent all-time high of 37,813. It has been an impressive rally since the October 27, 2023 low of 32,324 with the US 30 index jumping by around 16% higher in just two months. However, the [..]

post-image

Technical Analysis – AUDUSD shows some upside recovery again

Posted on January 4, 2024 at 8:05 am GMT

AUDUSD remains in bullish territory 50- and 200-day SMAs ready for bullish cross Stochastic looks oversold AUDUSD is recouping some losses of the preceding four red days after it found strong support at the 20-day simple moving average (SMA). Given the current positive momentum, the question now is whether the pair will stay resilient above the 0.6690 key region. A clear step below it would wipe out today’s boost, pressing the price back to the 50- and the 200-day SMAs at 0.6580, which are [..]

post-image

Technical Analysis – Gold begins 2024 on a weak note

Posted on January 3, 2024 at 9:45 am GMT

Gold has a cautious start to the new year Technical signals weaken but need confirmation   Gold opened the new year with mild losses after its bullish attempts to close above the May 2023 bar of 2,079 proved fruitless in the last week of December. The price is currently trading muted slightly below the 23.6% Fibonacci retracement of the previous upleg at 2,065 but there is still a ray of hope for another upturn. The RSI is still clearly above its [..]

post-image

Technical Analysis – Apple stock plummets to 7-week low

Posted on January 3, 2024 at 9:43 am GMT

Apple shares open with a negative price gap Barclays’ downgrade triggers the move Short-term oscillators tilt significantly to the downside Apple’s stock had been experiencing a steep uptrend since the October bottom of 165.50, posting a fresh record high of 198.08 in mid-December. However, the latter was followed by a mild pullback, which deteriorated after the price opened with a wide negative gap on Tuesday on the back of a Barclays’ downgrade. Should the weakness resume, the bears might push the price [..]

post-image

Technical Analysis – USDJPY buyers appear strong in 2024

Posted on January 3, 2024 at 8:09 am GMT

USDJPY shows some progress MACD and RSI turn up USDJPY started 2024 in a positive mode as it rebounded off the 140.90 support level with strong resistance  coming from the steep descending trend line. The RSI is below its 50 neutral mark, although it has strengthening, and the MACD is keeping its footing above its red signal line and within the negative area. Yet, the stochastic oscillator is looking for an upside reversal, but it’s uncertain if there is enough bullish power to boost the price [..]

Risk Warning: Your capital is at risk. Leveraged products may not be suitable for everyone. Please consider our Risk Disclosure.