XM does not provide services to residents of the United States of America.

Technical Analysis

post-image

Technical Analysis – Copper futures records new low; bias still bearish

Posted on May 31, 2019 at 12:05 pm GMT

Copper futures with delivery on July 2019 are declining with strong momentum over the last three days below the 20- and 40-simple moving averages (SMAs) in the daily timeframe and recording a four-month low of 2.6260 today. The technical indicators are remaining in the bearish territory, with the RSI sloping down in the oversold zone and the MACD posting a bearish cross with its trigger line. In case the price extends the bearish move, immediate support is expected to come from the 2.5750 barrier, [..]

post-image

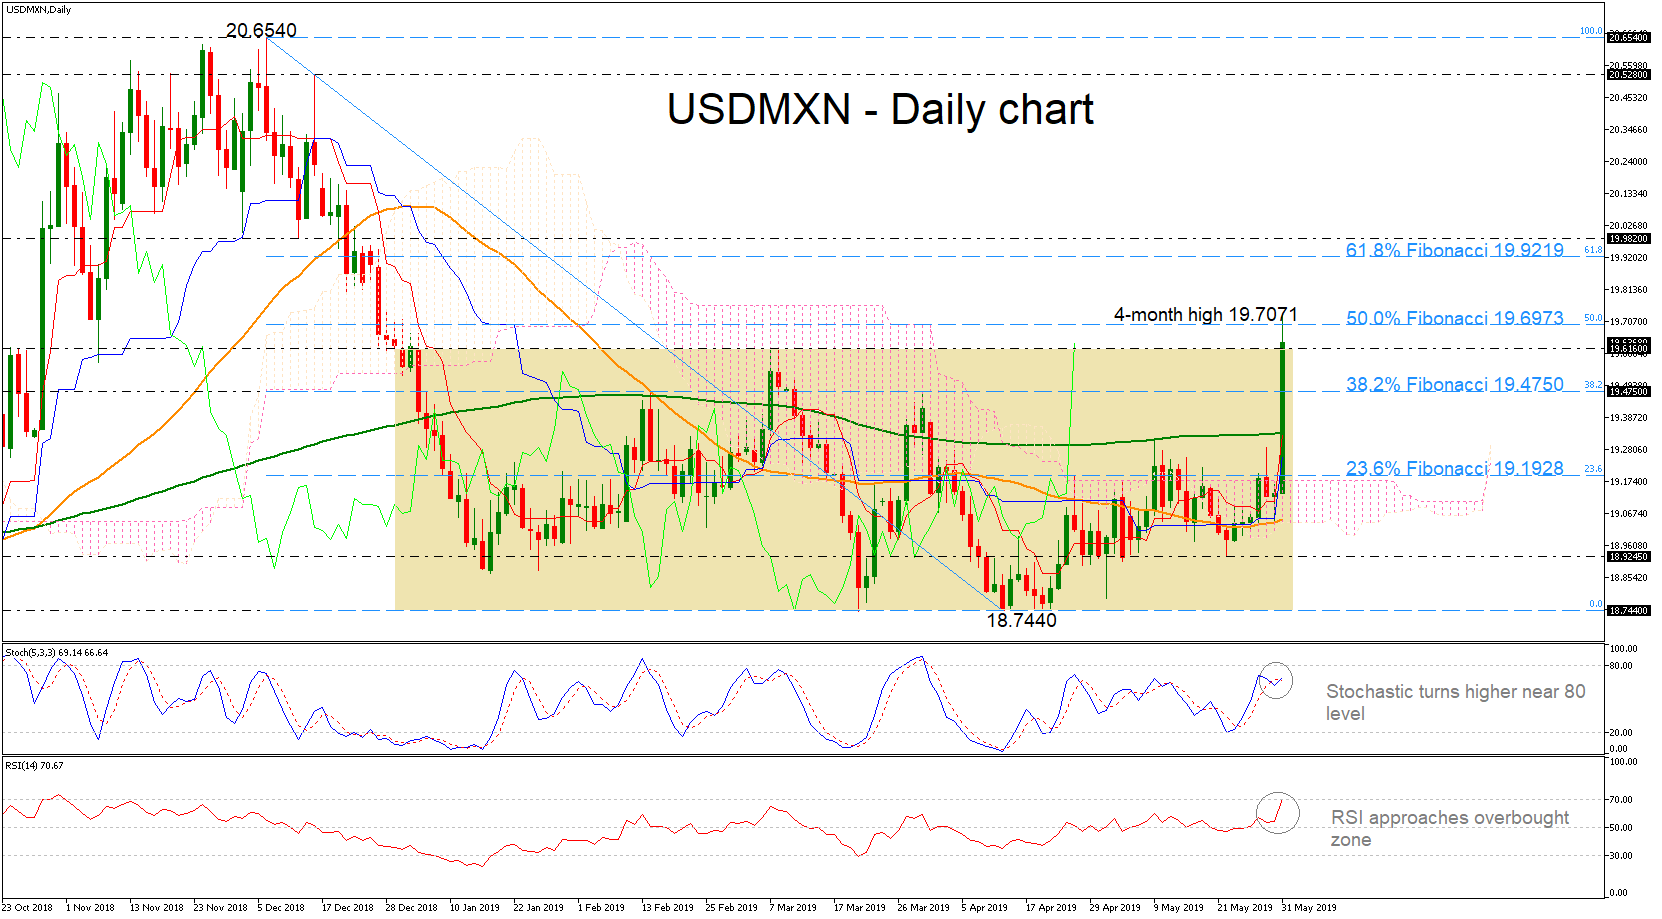
Technical Analysis – USDMXN rockets to 4-month peak; bias switches to bullish

Posted on May 31, 2019 at 8:39 am GMT

USDMXN skyrocketed to a fresh four-month high of 19.7071, penetrating the consolidation area of 18.7440 – 19.7071 to the upside and switching the short-term picture from neutral to positive. The technical indicators are feeding prospects for a positive short-term trading; the RSI is entering overbought territory, while the stochastic trends around the 80 level.  Also, in Ichimoku indicators, the red Tenkan-sen keeps rising above the blue Kijun-sen. If the 50.0% Fibonacci retracement level of the downleg from 20.6540 to 18.7440 around [..]

post-image

Technical Analysis – GBPAUD forms double top pattern

Posted on May 31, 2019 at 7:57 am GMT

GBPAUD has been in a congestion zone since mid-February, in what has started to look like a double top formation. The price, however, needs to break below the neckline positioned around 1.8095 to confirm the bearish pattern but with Stochastics warning over an oversold market, such a move may come with a delay. The 200-day simple moving average (SMA) currently at 1.8175 could halt downside movements ahead of the neckline. Crossing under the 1.8085 support area, the sell-off could turn more aggressive, with the bears probably [..]

Technical Analysis – USDCAD bulls face big challenge around 4-month high

Posted on May 31, 2019 at 6:39 am GMT

USDCAD is trading not too far from Wednesday’s new four-month high of 1.3550, following the rebound on the long-term ascending trend line in the daily timeframe. The momentum indicators suggest that there is still some advance for the pair. The RSI indicator is sloping upwards in the positive territory, while the MACD surpassed the trigger line and is rising above the zero line. Price action at the moment is above the Ichimoku cloud so the risks are to the upside. [..]

post-image

Technical Analysis – EURCAD forms symmetrical triangle; neutral in short term

Posted on May 30, 2019 at 1:48 pm GMT

EURCAD has been moving in a symmetrical triangle over the last seven months following the soft rebound on the 1.4750 support level. In the short-term, the market could maintain consolidation if the RSI keeps moving around 50 and the MACD near its zero line. Regarding the trend, this is likely to remain flat in the near-term as the 20- and 40-day simple moving averages (SMAs) continue to lose strength. An extension to the downside and below the moving averages could meet the area [..]

post-image

Technical Analysis – USDTRY tumbles below 38.2% Fibonacci and 50-SMA

Posted on May 30, 2019 at 12:22 pm GMT

USDTRY is aggressively diving to a fresh one-month low today, below the 38.2% Fibonacci retracement level of the downfall from 7.1135 to 5.1330 around 5.8855. Looking at the technical indicators, the RSI is slipping below the 50 level, suggesting a downward correction in the daily chart, while the MACD is still falling below the trigger line. Should the pair stretch south and penetrates the 5.8460 support and the 50-day moving average, the April 17 low of 5.7060 could provide immediate support before the pair touches [..]

post-image

Technical Analysis – US Dollar Index approaches 2-year high again; positive profile in long term

Posted on May 30, 2019 at 9:24 am GMT

The US dollar index is edging higher towards the two-year high of 98.25 over the last three consecutive days, remaining well above the long-term ascending trend line and the moving averages. The short-term bias is tilted to the upside as the RSI indicator is turning marginally higher in the positive region, while the trigger line of the MACD oscillator is rising in the positive region. If the index moves higher, the two-year high of 98.25 could attract traders’ attention once again and any violation above this [..]

post-image

Technical Analysis – NZDUSD hovers in Ichimoku cloud posting narrow range in near term

Posted on May 30, 2019 at 8:14 am GMT

NZDUSD has jumped into the Ichimoku cloud over the last few sessions as it found strong support around the 0.6505 barrier. The price touched the 40-simple moving average (SMA) in the 4-hour chart, and returned lower again, while the RSI indicator is also pointing down in the negative region. What remains to be seen is if the bears have enough fuel to continue the sharp negative movement or change the bearish bias to neutral. A move below the 40-SMA could [..]

Technical Analysis – GBPJPY creates bullish doji near 4 ½-month lows

Posted on May 30, 2019 at 7:41 am GMT

GBPJPY is in red for the fourth consecutive week, with the price pausing the sell-off at the 4 ½-month low of 137.85 on Wednesday. According to the RSI and the Stochastics, the pair is trading in oversold area and upside corrections are possible in the short term as the former hovers below 50 and the latter under 20. The bullish doji created yesterday could be another sign that a price reversal may be in progress. Should the market beat key resistance around 139.60, the door would open [..]

Technical Analysis – USDJPY bears could stay on the sidelines in short-term

Posted on May 30, 2019 at 6:43 am GMT

USDJPY is struggling to recover last week’s losses which drove the pair back into the 109 area but the positive slope of the RSI and the rebound in the Stochastics provide some optimism that the bears could stay on the sidelines in the short-term trading. The trend signals, however, are still negative as the pair has violated its January uptrend by creating a lower low and a lower high this month. A descent rally above the 110 level and the 20-day simple [..]

Risk Warning: Your capital is at risk. Leveraged products may not be suitable for everyone. Please consider our Risk Disclosure.