XM does not provide services to residents of the United States of America.

Technical Analysis

post-image

Technical Analysis – Facebook stock tumbles near 200-day SMA

Posted on June 4, 2019 at 12:22 pm GMT

Facebook stock price extended its losses over the previous couple of days, finding strong support at the 200-day simple moving average (SMA), marginally above the 38.2% Fibonacci of the wave 218.44 – 123.30 around 160.00. The RSI turned lower after entering oversold territory below 30. At the moment, it continues to head down in support of a negative short-term picture. The bias in the very-short-term also looks bearish as indicated by the MACD which is strengthening its negative momentum below [..]

post-image

Technical Analysis – BTCUSD slips sharply; could weaken further in short-term

Posted on June 4, 2019 at 9:47 am GMT

BTCUSD started the day sharply on the downside, moving closer to the bottom of the Ichimoku cloud and further below the 20- and 40-period simple moving averages (SMAs) in the 4-hour chart. The technical indicators are confirming the latest tweak as the MACD is strengthening its bearish momentum and the RSI is approaching the oversold zone. In case of further bearish action, immediate support could come from the 7590 barrier and the 38.2% Fibonacci of 7500. If there is a close below the latter the bitcoin could find another obstacle between the 7145 support level and [..]

post-image

Technical Analysis – GBPUSD recoups losses but downside risks not faded yet

Posted on June 4, 2019 at 7:24 am GMT

GBPUSD switched to recovery mode after bottoming to a five-month low of 1.2558 on Friday. With the RSI strengthening above its 30 oversold level and the MACD surpassing its red signal line, the pair may gain further ground in the short-term. Yet downside risks remain as long as the indicators hold in bearish territory. Note that the market has violated its December upward pattern after the drop below 1.2864. Immediate resistance to upside movements could emerge around 1.2750 but a closing price above 1.2770 – the 61.8% Fibonacci of [..]

Technical Analysis – WTI futures hovers above 4-month low; bearish bias may run out of steam

Posted on June 4, 2019 at 7:05 am GMT

WTI crude oil futures declined considerably towards a fresh four-month low of 52.11 on Monday, erasing the medium-term ascending movement in the daily chart. However, the downside momentum appears to have run out of steam as prices have been attempting and failing to close below the 61.8% Fibonacci retracement level of the upleg from 42.50 to 66.60 near 51.74. The stochastic oscillator is returning higher in the oversold zone, while the RSI is trying to gain ground below the 30 [..]

post-image

Technical Analysis – EURNZD remains under pressure below 20-day SMA

Posted on June 3, 2019 at 1:07 pm GMT

EURNZD is declining below the 20-day simple moving average (SMA) today, confirming the recent bearish structure in the near term. The RSI is moving towards the 50 level, while the MACD is holding below the trigger line but is still hovering above the zero line, increasing speculation for more downside pressure. In case the pair maintains its short-term direction to the downside after the bounce off the four-month high of 1.7195, the bears will probably challenge the 1.6960 support, which stands near the 200-day SMA and the [..]

post-image

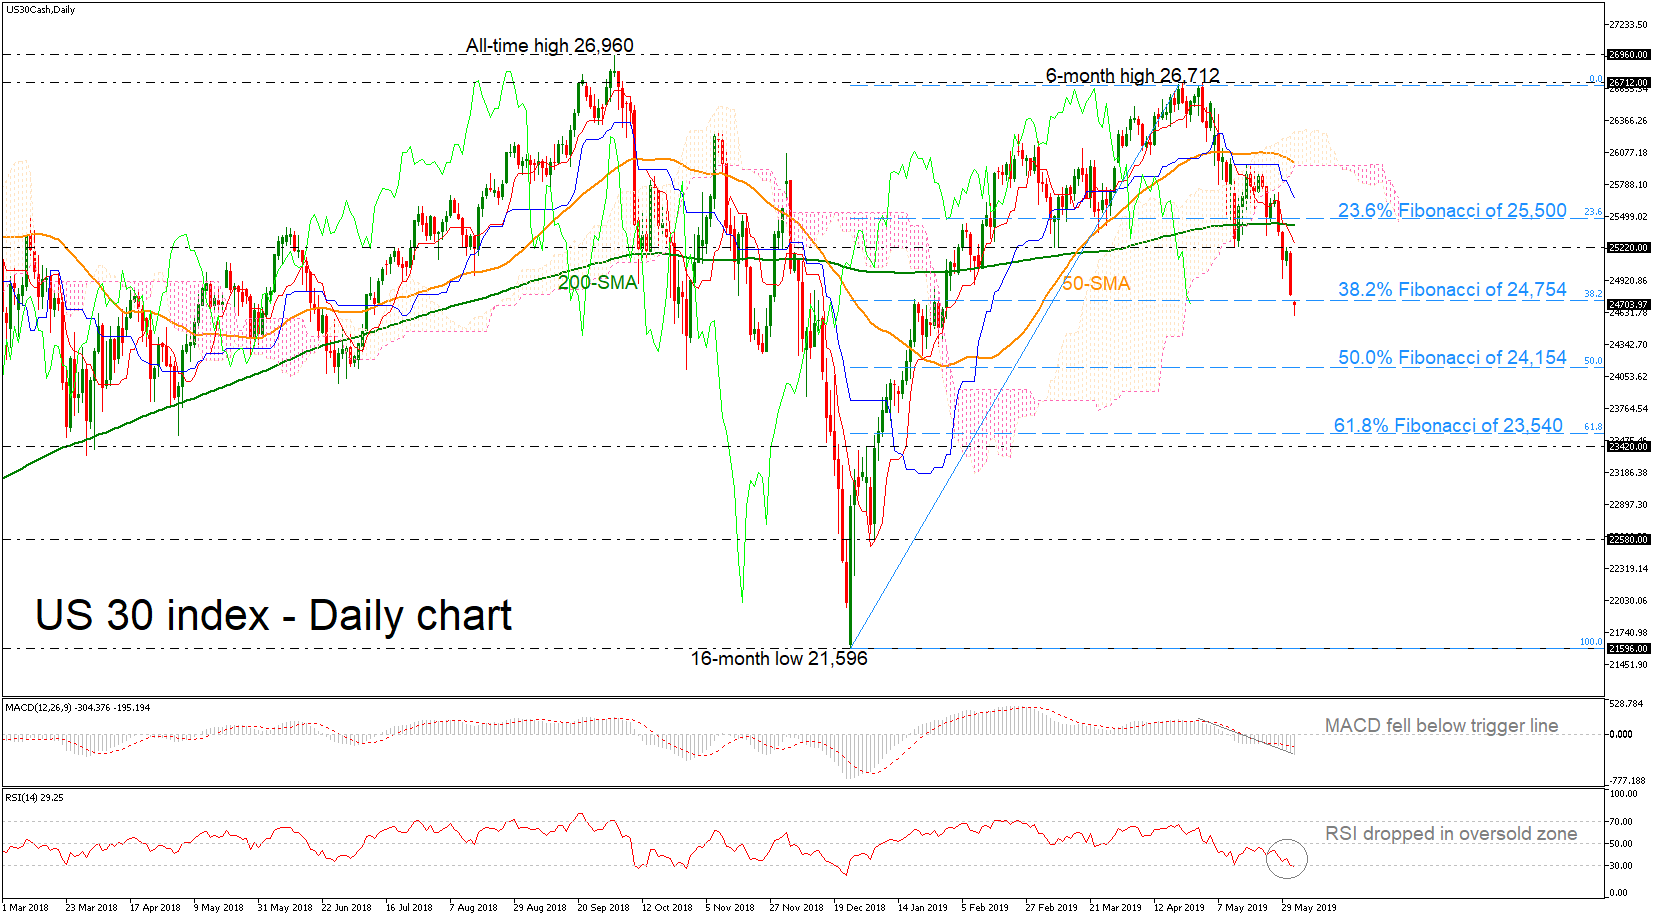
Technical Analysis – US 30 index opens with gap down; flirts with 4-month low

Posted on June 3, 2019 at 12:32 pm GMT

The US 30 index futures opened with negative gap today below the 38.2% Fibonacci retracement level of the upward movement from the 16-month low of 21,596 to the 6-month high of 26,712 near 24,754. The index is on the back foot, recording more than four-month low (24,606), and the technical indicators suggest that the market could ease a little bit more in the short-term; the MACD is falling in the negative zone, while the RSI looks to be losing momentum near oversold [..]

post-image

Technical Analysis – Gold advances considerably towards 2-month high

Posted on June 3, 2019 at 9:41 am GMT

Gold prices have been in a flying mode over the last couple of days, hitting a new two-month high around 1,315. The yellow metal jumped above the Ichimoku cloud and the 23.6% Fibonacci retracement level of the upleg from 1,160 to 1,346.61, near 1,302 as well as above the 1,310 barrier. The RSI and the stochastic oscillator signal that room for improvement is limited as the former is approaching the 70 overbought mark and the latter is rising above the 80 level in the daily timeframe. Yet the [..]

Technical Analysis – EURUSD trapped under 1.1200 key mark

Posted on June 3, 2019 at 7:12 am GMT

EURUSD resumed upside momentum on Friday but the gains were not enough to overcome the 1.12 key resistance area, with the price remaining below its simple moving averages (SMA) as well. The MACD continues to hold close to its red signal line and the RSI keeps fluctuating near the 50 neutral mark, both pointing to a sideways short-term trading. A decisive close above the previous high of 1.1214 and therefore higher than the 50-day SMA could spark a stronger rally, turning the spotlight to May’s peak of 1.1262. Running higher [..]

Technical Analysis – USDJPY plummets towards new 5-month trough around 108

Posted on June 3, 2019 at 7:02 am GMT

Since its deep fall towards five-month lows near 108.00 today, USDJPY has been plunging back below the 50.0% Fibonacci retracement level of the upleg from 104.64 to 112.40 near 108.55, creating a base beneath the short-term moving averages.  The technical picture supports that the aggressive downfall is likely to continue in the short-term. The %K line of the stochastic oscillator has fallen sharply into oversold levels and posted a bearish crossover with the %D line. Also, the RSI is dropping [..]

post-image

Technical Analysis – GER30 index breaches key support

Posted on May 31, 2019 at 12:12 pm GMT

GER30 index dived below a former key support area of 11,700 on Friday, signalling the continuation of the bearish action. The RSI is backing this view as well as the indicator keeps losing ground under its 50 neutral mark, while the MACD is giving extra negative warnings as long as it extending negative momentum below its red signal line. Traders however could wait for a decisive close below the 200-day simple moving average and the Ichimoku cloud before rapidly increasing [..]

Risk Warning: Your capital is at risk. Leveraged products may not be suitable for everyone. Please consider our Risk Disclosure.