XM does not provide services to residents of the United States of America.

Technical Analysis

Technical Analysis – GBPCHF bears keep pushing in oversold area

Posted on June 11, 2019 at 8:13 am GMT

GBPCHF bears are keeping control of the pair for the sixth consecutive week, driving it down by more than 6.0% since the peak at 1.3398 and near an almost five-month low of 1.2539. Specifically, the price is far below its simple moving averages (SMA) at the moment, suggesting that the downward pattern may not be easy to reverse in the short-term. The momentum indicators are also painting an overall cloudy picture for the short-term as the red Tenkan-sen continues to point down below the blue kijun-sen. The [..]

Technical Analysis – GBPUSD weakens below 20-day SMA; next support 1.2600

Posted on June 11, 2019 at 6:43 am GMT

GBPUSD failed several times to jump above the 20-day moving average and the 23.6% Fibonacci retracement level of the downward wave from 1.3380 to 1.2560, near 1.2753, suggesting weak momentum in the daily timeframe. The negative to neutral bias in the near term is supported by the deterioration in the momentum indicators. The %K line of the stochastic oscillator has fallen sharply below the overbought zone, while the RSI indicator is flattening in the negative territory. The 1.2600 psychological level has [..]

post-image

Technical Analysis – ETHUSD rebounds, surpassing 23.6% Fibonacci

Posted on June 10, 2019 at 1:30 pm GMT

ETHUSD has reversed back up after finding support at the 225 level, achieved earlier today. Momentum indicators are pointing to a positive bias in the 4-hour chart with the MACD just above trigger line and the stochastic oscillator is approaching the 80 level as the %K line is heading above the %D line. In the event of an upside reversal, the 253 resistance level could act as a barrier before being able to re-challenge the 270 obstacle. A break above [..]

post-image

Technical Analysis – US 100 index recovers notable losses in short term

Posted on June 10, 2019 at 12:19 pm GMT

The US 100 index advanced considerably in the previous week, penetrating the Ichimoku cloud following the rebound on the 6930 support level. However, the bulls have so far been unable to push the price above the 50-day simple moving average (SMA), but the technical indicators are moving north. The MACD surpassed the trigger line in the negative area while the RSI climbed above the 50 level. In case of further advances, a first line of resistance may be found near [..]

post-image

Technical Analysis – GBPAUD hovers near lower boundary of trading range

Posted on June 10, 2019 at 8:52 am GMT

GBPAUD has been trading in a consolidation area since February 19, with upper boundary the 35-month high of 1.8880 and lower boundary the two-month low of 1.8100. Currently, the price is edging slightly higher, with the short-term momentum indicators signaling a bullish bias. The RSI is pointing up in the negative territory, while the stochastic is moving towards the overbought area. The 20-day simple moving average (SMA) near the 1.8305 resistance could halt upside movements ahead of the 40-day SMA [..]

Technical Analysis – Gold turns overbought near former key resistance

Posted on June 10, 2019 at 8:30 am GMT

Gold recorded its best weekly performance so far this year, topping near a former key resistance of 1,346 on Friday. The RSI and the Stochastics, however, indicated that the bulls are exhausted as the measures peaked in overbought territory – letting the bears take over on Monday. Yet, with the 20-day simple moving average (SMA) increasing its distance above the 50-day SMA, the positive market trend may likely extend forward in the short-term. Should the market close comfortably below the 1,320 level, the bearish action may extend towards the upper surface of the Ichimoku cloud and the 23.6% [..]

Technical Analysis – EURUSD reverses near 1.1300 after posting 2½-month high

Posted on June 10, 2019 at 6:40 am GMT

EURUSD reached a two-and-a-half-month high of 1.1347 on Friday as the pair exited from the medium-term descending channel in the preceding days, signaling furhter upside movement. Prices are currently developing near the 1.1300 handle and are remaining above the Ichimoku cloud and the 20-and 40-day moving averages. Despite today’s pullback the bullish picture is further supported by short-term technical indicators. The MACD is strengthening its momentum above the trigger line, while the stochastic oscillator is entering overbought territory. To the [..]

post-image

Technical Analysis – AUDJPY bulls face big challenge around 20-SMA

Posted on June 7, 2019 at 11:24 am GMT

Selling interest is continuing in the AUDJPY market, remaining below the 20-day simple moving average (SMA). However, the technical indicators are suggesting a possible upside correction. The MACD is strengthening its bullish momentum above the trigger line, while the RSI is looking slightly positive in the negative threshold. Should positive pressure come in play and the price surpasses the 20-SMA obstacle, resistance could be faced around the 77.16 level, where the 40-SMA is standing. Above this level, the 77.50 resistance could be the [..]

post-image

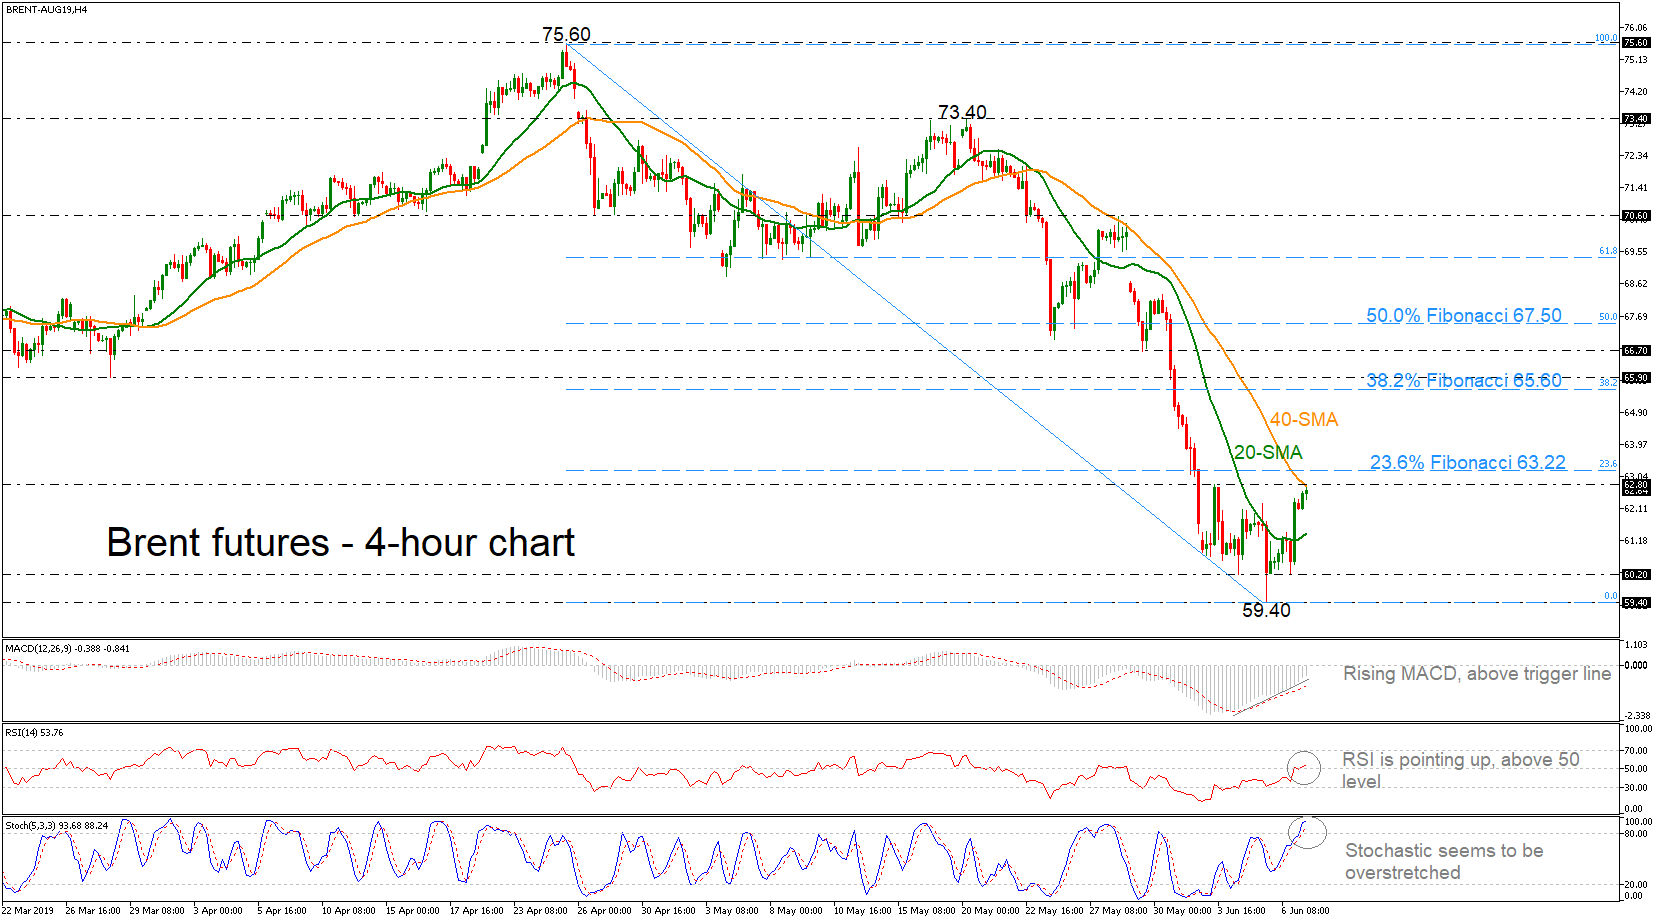
Technical Analysis – Brent futures return up but find obstacle at 40-SMA

Posted on June 7, 2019 at 8:37 am GMT

Brent crude oil futures has gained a little extra this week to jump above the 20-period simple moving average (SMA) and re-challenge the 40-SMA. The technical indicators are currently feeding prospects for a possible positive short-term trading as the RSI is holding above 50 level, while the MACD continues to strengthen above its trigger line. However, the stochastic oscillator is flagging overbought conditions, as it fluctuates above 80 with a softer positive slope. A failure to overcome the 62.80 resistance, could send the price down to the 20-SMA currently at 61.40 in the 4-hour chart. [..]

Technical Analysis – USDCAD indicators turn bearish; ascending line eyed

Posted on June 7, 2019 at 7:30 am GMT

USDCAD lost around 1.20% this week to fall back below its 20- and 50-day simple moving averages (SMA) and into the Ichimoku cloud, while the momentum indicators turned bearish, flagging further weakness ahead. The MACD entered the negative zone, deviating further below its red signal line, and the RSI slipped under its 50 neutral mark. The price, however, is currently testing the lower Bollinger band and is not far above the ascending line drawn from the 1.3067 bottom, a signal that further declines [..]

Risk Warning: Your capital is at risk. Leveraged products may not be suitable for everyone. Please consider our Risk Disclosure.