XM does not provide services to residents of the United States of America.

Technical Analysis

post-image

Technical Analysis – NZDUSD lacks direction in the very short-term

Posted on June 13, 2019 at 9:13 am GMT

NZDUSD has been holding within a narrow range over the last couple of days, with upper boundary the mid-level of the Bollinger band around 0.6590 and lower boundary the 0.6565 support level. The MACD is flattening near its red signal line, while the RSI is still hovering below the neutral threshold of 50, all signaling a more cautious trading in the short term. Traders would be eagerly looking for a break below 0.6565 to increase selling orders. If that’s the case, the rally could last until [..]

Technical Analysis – GBPJPY consolidates rebound; indicators trend up

Posted on June 13, 2019 at 8:19 am GMT

GBPJPY stabilized around a key barrier of 137.40 after bouncing on the five-month trough of 136.54. Although the RSI is currently sloping down, the indicator seems to be building an uptrend, confirming another higher high near its 30 oversold mark earlier this week. The MACD is also trending up above its red signal line, adding further hopes for a supported market in the short-term. The 20-day simple moving average (SMA) at 138.26 and the 61.8% Fibonacci of 138.75 of the upleg from 132.48 to 148.86 could [..]

Technical Analysis – USDJPY hovers below 109; descending channel holds in near term

Posted on June 13, 2019 at 6:42 am GMT

USDJPY has been on the sidelines for the most part of the week as the 109.00 level seems to be a real obstacle for the bulls. Over the last seven weeks the pair has been developing in a descending channel, erasing the bullish retracement from the 104.64 support. Technically, the price could lose some ground in the short-term as the RSI is moving downwards in the negative area, while the stochastic is creating a bearish cross within the %K and [..]

post-image

Technical Analysis – Copper futures attempt to break above descending channel

Posted on June 12, 2019 at 2:12 pm GMT

Copper futures for July delivery have unsuccessfully attempted to pierce the upper boundary of the one-month old descending channel (2.695) on Tuesday. The positive momentum in the MACD signals that upside pressures may return in the short-term, but the price may first need to crawl comfortably above 2.711, the 61.8% Fibonacci retracement of the 2.539-2.991 bullish wave, to fuel a stronger buying interest. On the way up, the 50% Fibonacci and the 200-day simple moving average (SMA), could hostage the bulls. If not, then the 38.2% Fibonacci of 2.818 could [..]

post-image

Technical Analysis – Netflix stock finds support at 23.6% Fibonacci and 20-SMA

Posted on June 12, 2019 at 1:21 pm GMT

Netflix stock price posted a significant red day on Tuesday, heading below the short-term moving averages in the daily timeframe, creating a neutral bias. The RSI indicator dropped beneath the 50 level, while the MACD oscillator is weakening below the trigger line over the last month, but it is still developing in the negative territory. In case of more losses, support could come below the 23.6% Fibonacci retracement level of the upleg from 230.60 to 385.73, around 351 at the 322 barrier. A [..]

post-image

Technical Analysis – USDMXN holds in Ichimoku cloud after negative gap

Posted on June 12, 2019 at 12:27 pm GMT

USDMXN has dropped considerably over the previous couple of days, after the negative gap, remaining within the 200- and 50-day simple moving averages (SMAs).  Currently, the pair is also hovering in the Ichimoku cloud and is trying to surpass the 23.6% Fibonacci retracement level of the downleg from 20.6540 to 18.7440 near 19.1938. Looking at the technical indicators, the stochastic oscillator is turning higher in the oversold zone, giving the impression for a bullish crossover of the %K and %D [..]

post-image

Technical Analysis – EURJPY eases below 3-week high in short term

Posted on June 12, 2019 at 9:17 am GMT

EURJPY had a bearish start on Wednesday, approaching the mid-level of the Bollinger Band (20-simple moving average) in the 4-hour chart, after the pullback on the three-week high of 123.15. The RSI and the MACD are suggesting a possible overstretched market as both are returning lower. The MACD is heading below the trigger line in the positive territory, while the RSI is pointing down below 70 level. In case the pair continues its short-term direction to the downside, the bears will probably challenge the [..]

Technical Analysis – EURGBP rally goes on; focus on 0.8935 key resistance

Posted on June 12, 2019 at 7:56 am GMT

EURGBP gained further positive traction this week, with the rally peaking at a fresh five-month high on Tuesday, marginally below the key resistance level of 0.8935. Technically the market could stretch the uptrend higher as long as the price keeps increasing its distance above its simple moving averages (SMA). The rising Tenkan-sen and a strong MACD above its red signal line is an indication that momentum may continue to the upside as well. Yet with the RSI moving sideways in an overbought area for almost a month now, downside corrections cannot be ruled out either. [..]

Technical Analysis – AUDUSD moves back towards 0.6900; positive rally faded

Posted on June 12, 2019 at 6:42 am GMT

AUDUSD continues to fall below the Ichimoku cloud, remaining in a downtrend over the last six months, stretching its movement towards the 0.6900 psychological level. According to the RSI, negative momentum could push for further losses in the short-term as the indicator loses steam below its neutral threshold of 50. The stochastic oscillator is also declining, approaching the oversold territory. The price is hovering within the simple moving averages (SMAs) and between the red Tenkan-sen and the blue Kijun-sen lines. The move could be extended on the [..]

post-image

Technical Analysis – WTI futures lack clear direction in short-term; medium-term downtrend intact

Posted on June 11, 2019 at 9:14 am GMT

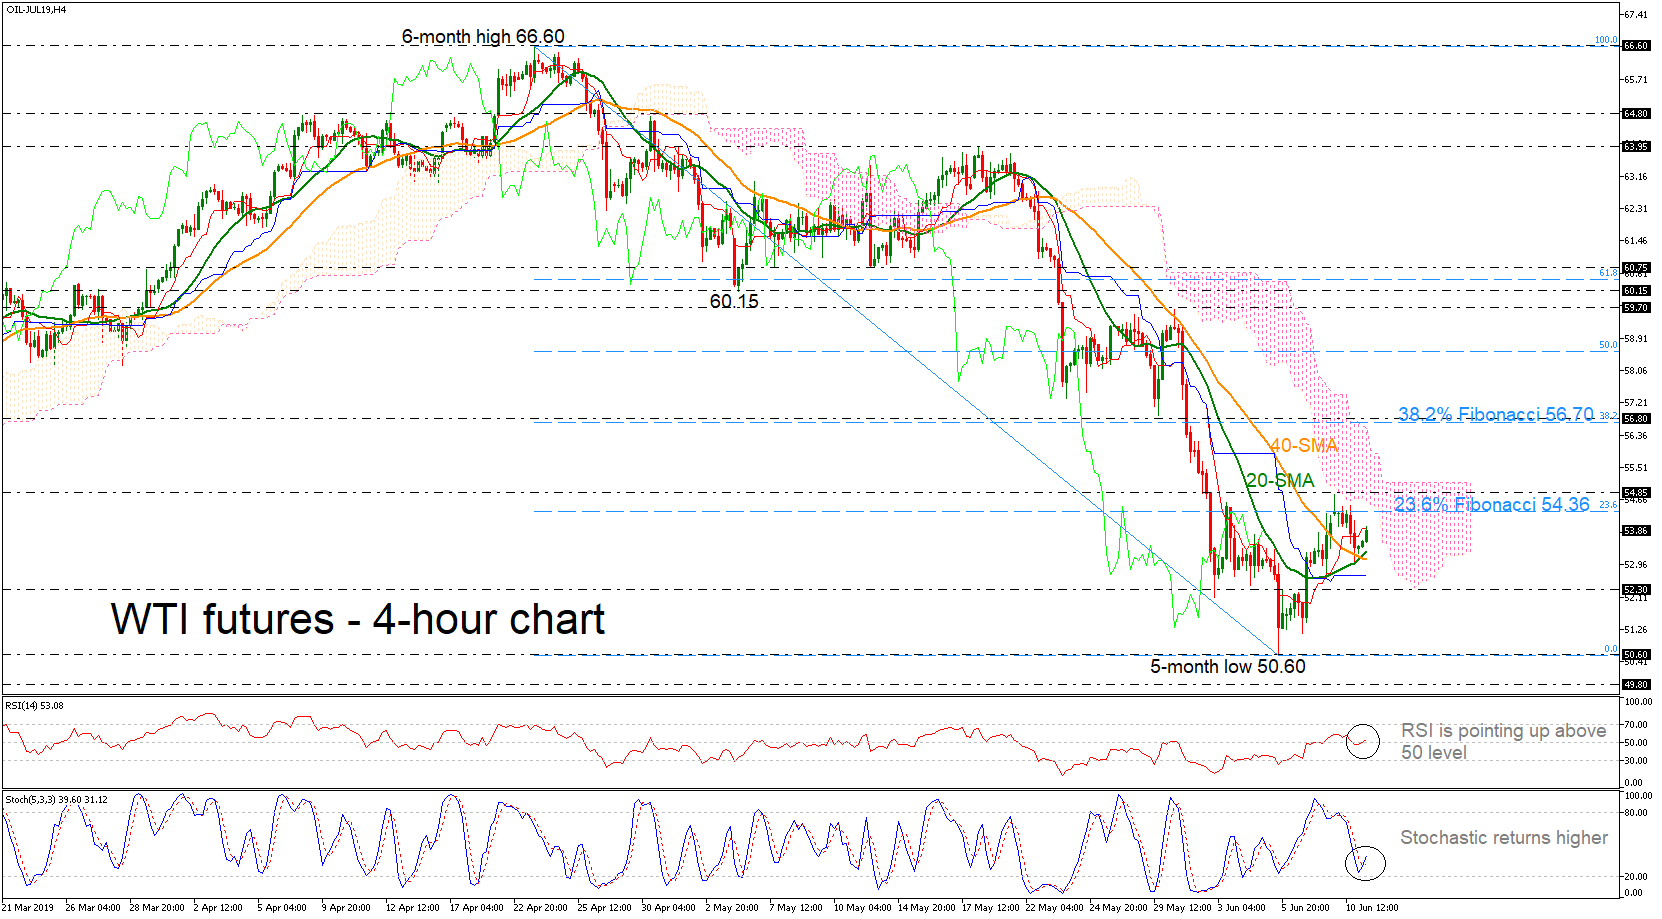
WTI crude oil futures are rising above the bullish cross within the 20- and 40-simple moving averages (SMAs) but are still hovering below the Ichimoku cloud in the 4-hour chart. The downside momentum appears to have run out of steam as the stochastic oscillator is returning higher while the RSI is trying to gain ground above the neutral threshold of 50. Should oil prices manage to strengthen the slightly bullish retracement the next resistance could come around the 23.6% Fibonacci [..]

Risk Warning: Your capital is at risk. Leveraged products may not be suitable for everyone. Please consider our Risk Disclosure.