XM does not provide services to residents of the United States of America.

Technical Analysis

Technical Analysis – USDJPY still bearish below moving averages

Posted on June 19, 2019 at 7:04 am GMT

USDJPY remains stuck in a bearish phase as the momentum oscillators struggle in negative territory. The RSI is trending downwards below the 50 level, while the MACD histogram is heading back down below 0, though it’s holding above its red signal line for now. Prices are currently being capped by the 108.75 level, whish is the 61.8% Fibonacci retracement of the upleg from 106.50 to 112.39. The 20-day moving average also lies in that region, suggesting this could prove a [..]

post-image

Technical Analysis – Gold spikes to 14-month highs; could gain more

Posted on June 18, 2019 at 2:16 pm GMT

Gold bulls took over again on Tuesday, driving the price near Friday’s 14-month high of 1,358. The location of the RSI – above 70 – hints that the bullish action may be overdone, and therefore no space is left for additional upside. However, with the Stochastics trending under the 80 oversold level and the MACD strengthening momentum above its red signal line, the market may see further improvement before potentially reversing lower. The 1,356-1,365 area is the next target, while slightly higher the 2016 peak of [..]

Technical Analysis – EURUSD bears pierce 1.12 support level; negative bias strengthens

Posted on June 18, 2019 at 11:55 am GMT

EURUSD is currently trading below the 1.1200 level that kept bears in check in the previous two sessions, with the RSI and the MACD suggesting more downside to follow as the former is losing momentum below its 50 neutral mark and the latter is weakening below its red signal line. Should the market come under stronger negative pressure, the 1.1110 bottom could prove tough to break through as it did earlier this year. If not, the selling may get new legs, with support coming next somewhere between 1.10-1.0950. [..]

Technical Analysis – GBPUSD revives downtrend; bearish in short and medium-term

Posted on June 18, 2019 at 7:09 am GMT

GBPUSD reactivated the downtrend started from the 1.3380 peak to reach a fresh six-month low of 1.2510 on Tuesday. Technically, the pair could lose further momentum as the MACD is crossing below its red signal line. However, with the RSI rebounding on its 30 oversold mark and the Stochastics set for a bullish cross under 20, upside corrections cannot be ruled out in the very short-term. The area between 1.25 and 1.2475 could be closely watched if the market extends on the downside. Breaking that [..]

post-image

Technical Analysis – EURAUD tries to jump above ascending channel; strongly positive

Posted on June 14, 2019 at 9:59 am GMT

EURAUD is extending its gains over the last couple of weeks, recording a fresh more than five-month high around 1.6350. Thus, the short-term picture thus seems to be strongly positive, as the RSI is hovering in the overbought territory and the MACD is strengthening its momentum above trigger line. A break above above the ascending channel could increase speculation for more upside pressure towards the 1.6590 resistance level. If the bulls pierce the latter too, attention would turn to 1.6662. [..]

Technical Analysis – US 500 stock index may chart another pick up

Posted on June 14, 2019 at 9:10 am GMT

US 500 index showed little change after opening the week with a small positive gap above its 50-day simple moving average (SMA). The distance between the MACD and its red signal line and the bullish momentum in the indicator suggests there is some room for improvement, but in the very short-term a consolidation phase may follow if the fast RSI continues to grind sideways. A closing price above the 2,909-2,936 area and therefore on top of the Ichimoku cloud could trigger [..]

Technical Analysis – USDCAD bulls return into play; remains beneath uptrend line

Posted on June 14, 2019 at 6:43 am GMT

USDCAD gained some ground after the aggressive sell-off towards the three-month low of 1.3240, penetrating the long-term ascending trend line to the downside. The technical indicators are feeding prospects for a possible positive short-term trading; the RSI is pointing up below 50, while the stochastic continues to strengthen its momentum. A decisive close above the 23.6% Fibonacci retracement level of the upward wave from 1.2250 to 1.3664 near 1.3330 could add more value to the pair, pushing the market up to [..]

post-image

Technical Analysis – EURCHF eases in downward sloping channel; negative overall

Posted on June 13, 2019 at 1:20 pm GMT

EURCHF is retreating today, falling below both its 20- and 40-day simple moving averages (SMAs) as well as beneath the 23.6% Fibonacci retracement level of the downleg from 1.1710 to 1.1120 near 1.1260. The bigger picture still seems negative as the price has been developing in a descending channel since September 2018. Short-term momentum oscillators concur, with the RSI already below 50 and pointing lower, and the stochastic is posting a bearish cross within the %K and %D lines in the [..]

post-image

Technical Analysis – US Dollar Index rebounds on ascending line; gains are expected

Posted on June 13, 2019 at 12:29 pm GMT

The US dollar index found a strong support obstacle on the long-term ascending trend line once again, sending the price higher. The short-term bias is tilted to the upside as the stochastic oscillator is approaching the overbought area with stronger momentum than before in the daily timeframe. If the index moves higher, the 50-day simple moving average (SMA) currently at 97.25 and the 97.40 resistance level could attract traders’ attention before the price hit the two-year high of 98.25. Any violation above this hurdle could [..]

post-image

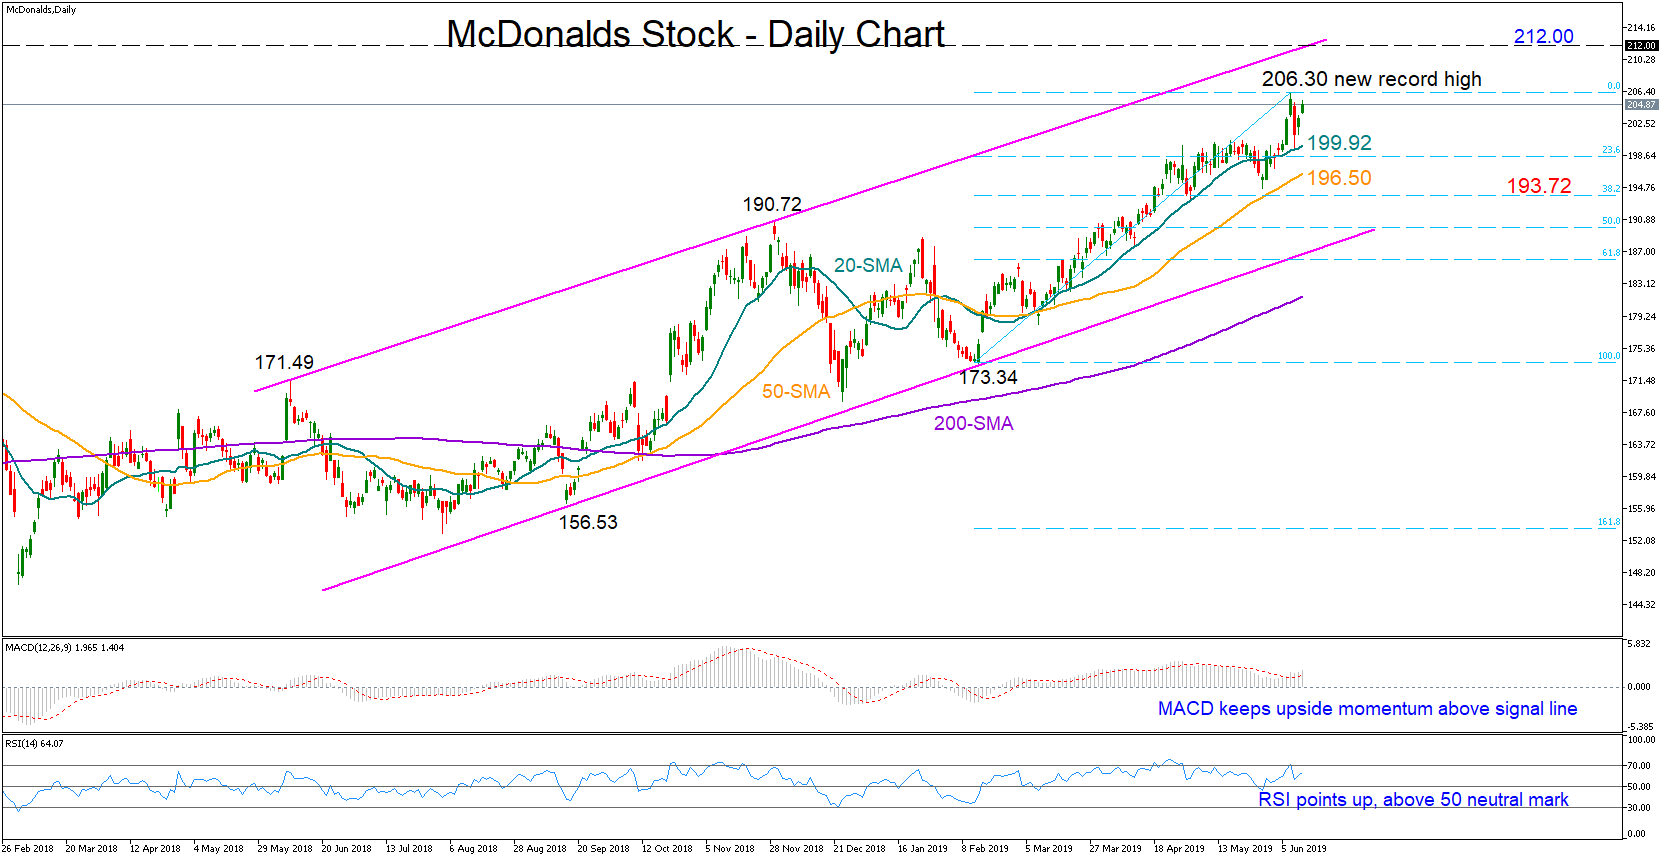
Technical Analysis – McDonald’s stock extends series of record highs

Posted on June 13, 2019 at 10:02 am GMT

The burger chain saw its stock hitting a new record high of 206.30 on Friday, marking a growth of 17% for the year. The 20-day simple moving average (SMA) helped the bulls to retake control this week, while the positive momentum in the MACD and the RSI suggests the bullish party is not over yet for the stock. The peak at 206.30 could potentially work as nearby resistance should the price continue the rebound. Nevertheless, it would be more fascinating to see a rally towards the upper boundary of the long ascending [..]

Risk Warning: Your capital is at risk. Leveraged products may not be suitable for everyone. Please consider our Risk Disclosure.