XM does not provide services to residents of the United States of America.

Technical Analysis

Technical Analysis – Gold shines near six-year high; rally could stall but not end

Posted on June 24, 2019 at 9:13 am GMT

Gold bulls got extra energy on Friday, driving the price towards an almost six-year high of 1,411. Downside corrections are likely in the very short term as the stochastics are set for a bearish cross above 80 overbought mark. The MACD however, has yet to show any sign of weakness, an indication that any slowdown in the market may be short-lived. Slightly higher, the 50% Fibonacci ratio of 1,421 of the three-year old downleg from 1,796 to 1,046 could prove a trigger point for another bullish [..]

Technical Analysis – EURUSD beats 200-day SMA for first time in a year

Posted on June 24, 2019 at 7:13 am GMT

EURUSD staged a quick recovery last week, with the price crawling above the 200-day simple moving average (SMA) for the first time in more than a year. On Monday, the bullish pattern gained extra credence as the pair extended its positive momentum towards a new three month high of 1.1385. According to the RSI, which maintains a positive slope above its 50 neutral mark, there is still some upside in store. The indicator, however, is not far above the 70 overbought level, a sign that downside corrections [..]

post-image

Technical Analysis – Silver pulls back from 3-month high

Posted on June 21, 2019 at 11:46 am GMT

Silver reversed to the downside early on Friday but the 20-period simple moving average (SMA) in the four-hour chart managed to halt the bearish correction as it did a few days ago. The RSI and the MACD lost momentum as well, endorsing the negative move in the price. Yet, as long as both indicators remain in bullish area – the former above 50 and the latter above its red signal line – chances for a sharp downfall are weak. The 23.6% Fibonacci of 15.24 of the 14.27-15.43 upleg [..]

Technical Analysis – AUDUSD capped below 200-SMA

Posted on June 21, 2019 at 9:39 am GMT

The 200-period simple moving average (SMA) in the four-hour chart seems to be a hurdle for the AUDUSD bulls over the past two days, and the falling RSI which heads towards its 50 neutral mark suggests that the market may stabilize in the short-term.  Exceeding the 200-period SMA and more importantly the upper surface of the Ichimoku cloud currently at 0.6940, the rally may get new steam, probably until the 0.6965 former resistance area. Further up, the bulls could retest [..]

Technical Analysis – USDCHF falls the most in three years; looks oversold

Posted on June 21, 2019 at 7:04 am GMT

USDCHF experienced its worst daily trading in more than three years on Thursday, posting a sharp dip towards a 6 ½ -month low of 0.9790. The price is currently hovering around the lower Bollinger band, while the RSI is set to shift higher after hitting its 30 oversold mark, a warning that the bearish action may not continue in the short-term. Yet with the market action taking place well below moving averages, the pair may need extra time to correct the recent downtrend that started from the [..]

post-image

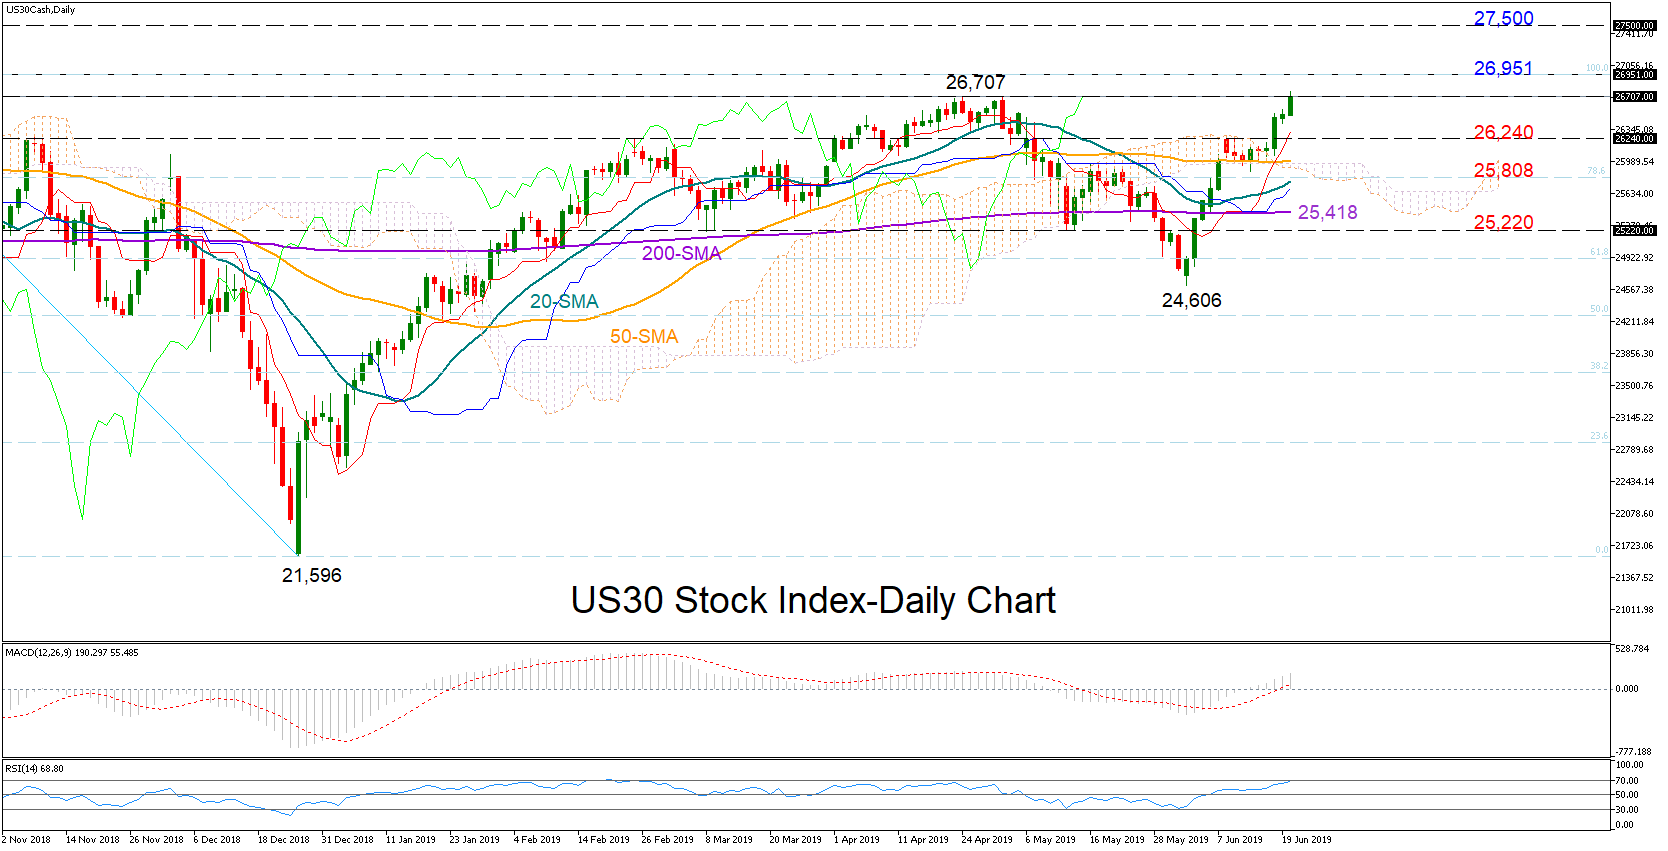
Technical Analysis – US30 index returns to record highs

Posted on June 20, 2019 at 2:54 pm GMT

US30 stock index (Dow Jones) is currently flirting with May’s peak of 26,707 but the positive momentum in the MACD, which trends above its red signal line, suggests that September’s record high of 26,951 could be achievable as well. Still, the RSI warns that the market is approaching overbought territory and hence downside corrections cannot be ruled out. Clearing the 26,951 ceiling, the bulls would aim to test the uncharted area between 27,000 and 27,500. Otherwise, if the market weakens [..]

post-image

Technical Analysis – WTI oil futures rally to 3-week high after breaking 50% Fibo

Posted on June 20, 2019 at 1:48 pm GMT

WTI oil futures for August delivery managed to break resistance around the 50% Fibonacci of the 42.53-66.57 upleg and pick up steam towards a new three-week high of 56.33 on Thursday. However, buyers would like to see prices running above the 38.2% Fibo of 57.37 and the 200-period simple moving average (SMA) in the four-hour chart to put faith in the recent rally.  Should the MACD and the red Tenkan-sen continue sloping upwards such a case may occur in the near-term. Slightly up, [..]

post-image

Technical Analysis – BTCUSD bulls rest below 38.2% Fibonacci

Posted on June 20, 2019 at 12:54 pm GMT

Bitcoin is stubbornly testing the 38.2% Fibonacci ratio of the long 19,384-3,187 bearish wave for the fourth consecutive session that the bulls failed to successfully breach a year ago. While the slowdown in the red Tenkan-sen and the blue Kijun sen could be a warning sign that the bullish action may soon fade, the market could chart another rally if the MACD continues to trend higher and above its red signal line. Crossing above the 38.2% Fibo of 9,331, nearby resistance could be detected around [..]

Technical Analysis – GBPJPY could recoup some losses in short term

Posted on June 20, 2019 at 9:23 am GMT

GBPJPY registered another lower low at its March downleg slightly below the key support level of 135.79, but it soon bounced up again as the RSI signaled oversold conditions. The latter is currently moving with a positive slope towards its 50 neutral mark, while the MACD continues to trend up above its red signal line, both suggesting some recovery in the short term. The price, however, needs to overcome the 20-day simple moving average (SMA) and a former support region of 137.40 to [..]

Technical Analysis – USDCAD slumps below 200-day SMA; looks bearish in short-term

Posted on June 20, 2019 at 6:48 am GMT

USDCAD gave up last week’s gains and slumped below the 200-day moving average (SMA) and towards a more than a three-month low of 1.3231 on Thursday. According to the RSI and the fast Stochastics, the market could turn even bearish in the near-term as both indicators are sloping downwards and are still above oversold territory. The spotlight is currently turned to the 1.3200 support level. Should the price break that barrier, selling pressure could intensify until the 1.3111 trough and then down [..]

Risk Warning: Your capital is at risk. Leveraged products may not be suitable for everyone. Please consider our Risk Disclosure.