XM does not provide services to residents of the United States of America.

Technical Analysis

Technical Analysis – GBPJPY likely waiting for a trend reversal

Posted on June 28, 2019 at 8:31 am GMT

GBPJPY had an uneventful trading for another week, remaining stuck between the 137.40 resistance and the 135.79 key support, which coincides with the 78.6% Fibonacci of the upleg from 132.48 to 148.86 . There is however a bullish divergence signal of a possible trend reversal , as the RSI and the MACD continue to print higher lows at a time when the price keeps trending downwards, suggesting that the market may soon change direction. A strong rally above the previous [..]

Technical Analysis – EURNZD drops aggressively this week; records 3-week low 

Posted on June 28, 2019 at 6:46 am GMT

EURNZD lost ground this week, dropping to a new three-week low near 1.6950 today after finding strong resistance at the eight-month high slightly above the 1.7300 psychological mark. The short-term moving averages are ready to create a bearish cross, signaling more losses, while the technical indicators are losing momentum. The RSI is hovering below the 50 level and the MACD slipped beneath its trigger line and stands near the zero line. However, should the price close comfortably below the strong [..]

post-image

Technical Analysis – USDCNH strictly capped below moving averages

Posted on June 27, 2019 at 12:54 pm GMT

USDCNH had a bearish start on Thursday, with the price remaining below a crucial support of the 6.9000 barrier and the 40-day simple moving average (SMA). From the technical point of view, the RSI is heading down in bearish territory, while the MACD also supports a bearish picture, since it continues to hold near the zero line and below the trigger line. Should prices drop below the 6.8300 low, they could hit the 23.6% Fibonacci retracement level of the upward movement from 6.2350 to 6.9781, near [..]

post-image

Technical Analysis – GBPAUD records red sessions in trading range

Posted on June 27, 2019 at 8:52 am GMT

GBPAUD is posting red days, hovering around the lower boundary of the trading range (1.8100 – 1.8880), which has been standing since February 19. The RSI is pointing down in the negative territory, while the stochastic is holding in the oversold area. Should the market continue its downside direction and penetrate the range, support could initially emerge between 1.8100-1.8043, which overlaps with the 50.0% Fibonacci of the upleg from 1.7220 – 1.8880. Even lower, a rally could find an obstacle at the 1.7990 region [..]

Technical Analysis – USDCAD looks for a rebound after hitting 4 ½-month lows

Posted on June 27, 2019 at 7:30 am GMT

USDCAD stretched the bearish wave towards 1.3100 on Thursday, the lowest level reached in 4 ½-months, but the RSI and the Stochastics suggest that it’s time for an upside correction as both indicators are currently fluctuating near oversold territory. The 1.3165 mark could potentially provide immediate resistance if the market attempts to recover. Breaking that line, the bulls should breach the 1.3200-1.3228 area to take the rally towards the 200-day simple moving average (SMA) and the 1.3300 level. On the [..]

Technical Analysis – NZDUSD pulls back near 2-month high; remains in sideways channel

Posted on June 27, 2019 at 6:52 am GMT

NZDUSD stretched its seven-day rally to a more than two-month high of 0.6690 on Wednesday, remaining within the Ichimoku cloud. The price advanced above the bullish cross within the 20- and 40-simple moving averages (SMAs) and is trying to exit from the two-month congestion area of 0.6490 – 0.6680. The near-term bias is looking neutral-to-bullish as the RSI is flatlining above the 50-neutral level, while the MACD is strengthening its positive momentum well above its trigger line, suggesting more upside pressure in [..]

post-image

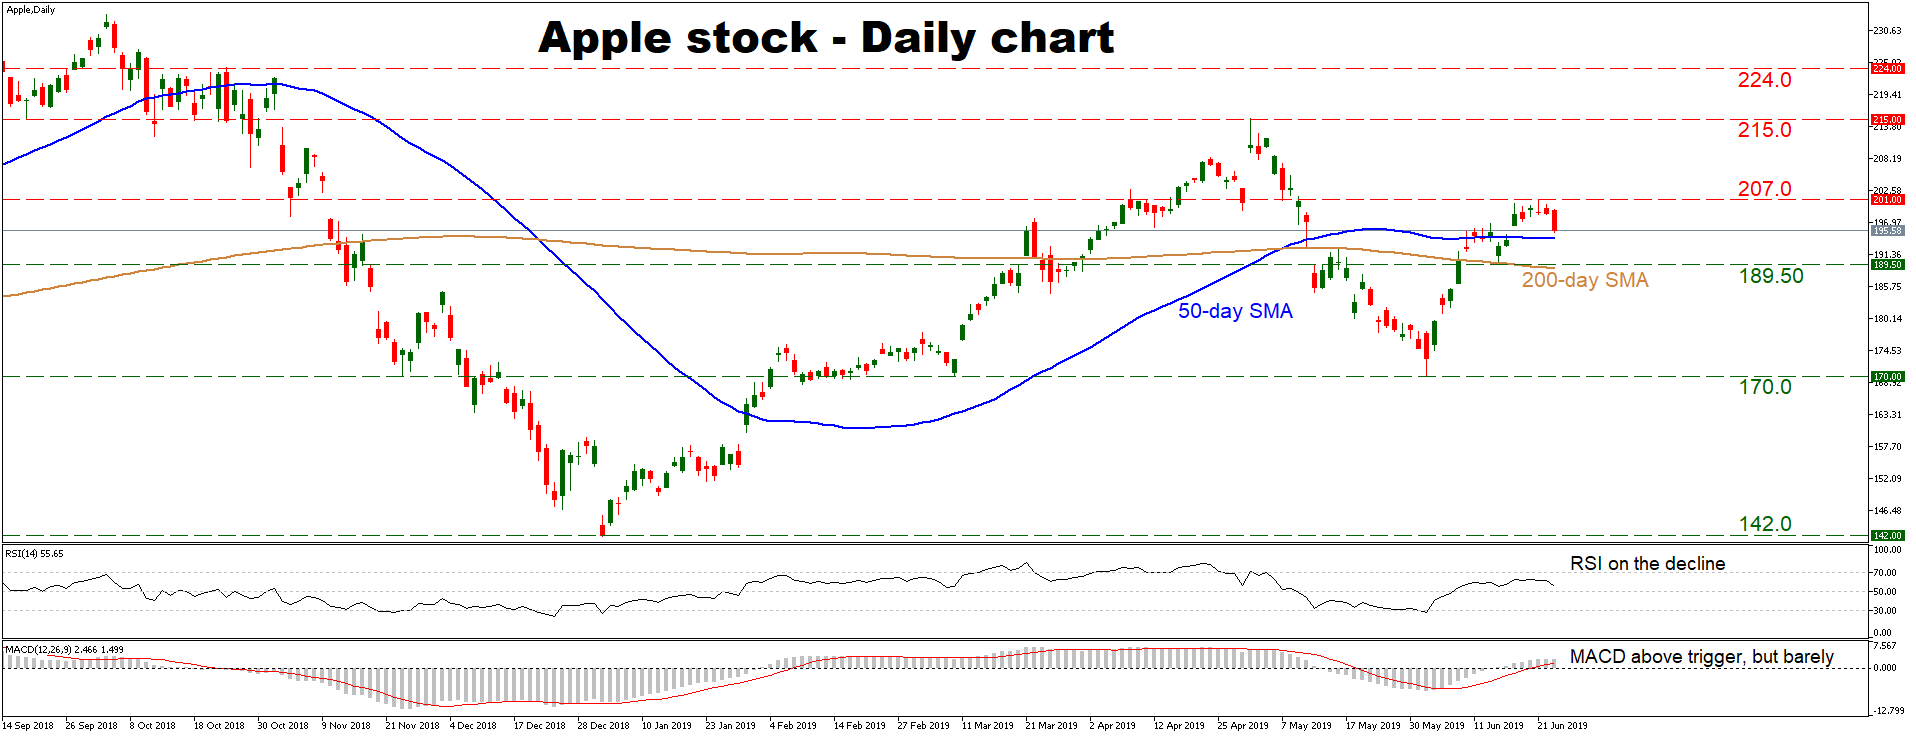
Technical Analysis – Apple recovers some ground, but remains neutral

Posted on June 26, 2019 at 1:38 pm GMT

Apple’s stock has recovered somewhat in the past weeks but has failed to record a higher high on the daily chart, which keeps the medium-term picture neutral for now. A break above 215.0 would turn the outlook to cautiously positive, while a move below 170.0 would shift it to tentatively negative. Short-term momentum oscillators aren’t sending any clear signals either, with the RSI pointing down but being near its neutral level, while the MACD is hovering just above its red [..]

post-image

Technical Analysis – ETHUSD flies towards 11-month high; strongly positive

Posted on June 26, 2019 at 1:31 pm GMT

ETHUSD skyrocketed towards a new eleven-month high of 346.57 earlier today, holding well above the 20- and 40-simple moving averages (SMAs) in the 4-hour timeframe. Momentum indicators are standing in the positive area in the 4-hour chart with the MACD just above the trigger line and the stochastic oscillator looking overstretched above the 80 level. In the event of an upside reversal, the 352 resistance level could act as a barrier, registered on April 2018. A break above this level would open [..]

post-image

Technical Analysis – Tesla stock rebounds, but remains in a downtrend

Posted on June 26, 2019 at 12:00 pm GMT

Tesla’s stock rebounded in early June after touching a 2½-year low of 175.0, but the market remains below a longer-term downtrend line drawn from the highs of December 2018, keeping the broader outlook negative. The lower highs and lower lows on the daily chart, combined with price action taking place under the 50- and 200-day simple moving averages (SMAs), reinforce this view. Momentum indicators paint a neutral short-term picture, with the RSI barely above 50, and the MACD flirting with [..]

post-image

Technical Analysis – US 500 index may pick up steam above all-time high

Posted on June 26, 2019 at 11:59 am GMT

The US 500 index retreated below the all-time high of 2964 in the previous couple of days, testing the red Tenkan-sen line in the daily timeframe. The 200-simple moving average (SMAs) remains flat, failing to confirm the long-term bullish picture. The MACD is extending is bullish run with weak momentum while the RSI is pointing north in the positive zone. A closing price above the all-time high (2964) could trigger another bullish phase more likely towards the 3000 psychological mark. Should [..]

Risk Warning: Your capital is at risk. Leveraged products may not be suitable for everyone. Please consider our Risk Disclosure.