XM does not provide services to residents of the United States of America.

Technical Analysis

post-image

Technical Analysis – GBPAUD continues sell-off near 6-month bottom

Posted on July 17, 2019 at 12:44 pm GMT

GBPAUD extended its losses towards a new six-month low of 1.7630 on Tuesday, recording five straight red days. The selling interest started after the pullback on the almost three-year high of 1.8880, pushing the pair beneath the short-term moving averages and the Ichimoku cloud. The RSI indicator is hovering in the oversold zone; however, the stochastic oscillator is in process to post a bullish crossover within its lines, indicating weaker bearish movement than before. Further declines may meet support at [..]

post-image

Technical Analysis – US dollar index surpasses 50-day SMA, suggesting more gains

Posted on July 17, 2019 at 9:07 am GMT

The US dollar index had a successful daily close above the 50-simple moving average (SMA) suggesting remarkable gains, during yesterday’s trading session. The stochastic oscillator is moving higher after it completed a bullish crossover within the %K and %D lines, while the MACD is trying to strengthen its bullish momentum above zero line. Should the price stretch north and clear the 97.20 resistance, the two-year high of 98.25 could come in focus. If the buying interest extends, attention could then [..]

post-image

Technical Analysis – EURJPY descends into a symmetrical triangle; nears lower boundary

Posted on July 17, 2019 at 8:45 am GMT

EURJPY slid down in the last week to near the lower boundary of a symmetrical triangle, that began almost two months ago on May 21, where the seller’s momentum evaporated. Today sellers are pushing down again heading for a retest. Following the price decline from the upper boundary to the lower boundary, the MACD moved to the negative area where both the MACD and trigger line flattened out. The RSI trended down and is currently flat but pointing slightly south [..]

Technical Analysis – AUDUSD prints bearish doji and shifts lower

Posted on July 17, 2019 at 7:19 am GMT

AUDUSD changed direction to the downside after printing a bearish doji near the two-month high of 0.7046 in the four-hour chart, keeping the market within the 0.7046-0.6900 range. The price has also retreated below the 20-period simple moving average (SMA), while the weakness in the RSI and the MACD is an additional warning that bearish sentiment is likely to stay in the short-term. A decisive close below the 0.70 mark could trigger fresh selling towards the key 0.6965-0.6950 key area, where the 200-period SMA [..]

Technical Analysis – EURGBP unlocks 6-month high; looks overbought

Posted on July 17, 2019 at 6:55 am GMT

EURGBP skyrocketed in the preceding couple of days, challenging a new six-month high of 0.9046. The rebound on the 0.8490 drove the pair to an upside rally above the 20- and 40-simple moving averages (SMAs) in the daily timeframe, confirming the bullish tendency. However, looking at the technical indicators, they seem overbought, suggesting a possible downside pullback. The MACD oscillator is weakening a bit slightly below the trigger line in the positive area, while the RSI is flattening after it [..]

post-image

Technical Analysis – Microsoft consolidates at all-time highs; sellers grab the reins to rally down

Posted on July 17, 2019 at 5:22 am GMT

Microsoft stock has been in a seven-month ascending channel since December but last week ran into a wall near the previous all-time high of 138.34 set two weeks ago. Sellers have picked themselves up and today started to push down. Although the bullish bias from the 21-, 50- and 100-day simple moving averages (SMAs) is apparent, the MACD seems to suggest a negative divergence causing a fall in momentum as the MACD and trigger line flatten out in the positive [..]

post-image

Technical Analysis – USDCHF reverses higher but remains bearish in medium term

Posted on July 16, 2019 at 1:10 pm GMT

USDCHF rebounded on the 38.2% Fibonacci retracement level of the upleg from 0.9185 to 1.0235 near 0.9830 during yesterday’s trading session, touching the 20-day simple moving average (SMA). In the short-term, the market could turn positive if the RSI keeps moving around the 50 level, however the red Tenkan-sen line, as well as the blue Kijun-sen line, hold flat. The stochastic oscillator seems ready to turn higher again as the %K line touches the oversold zone and is sloping up. An extension [..]

post-image

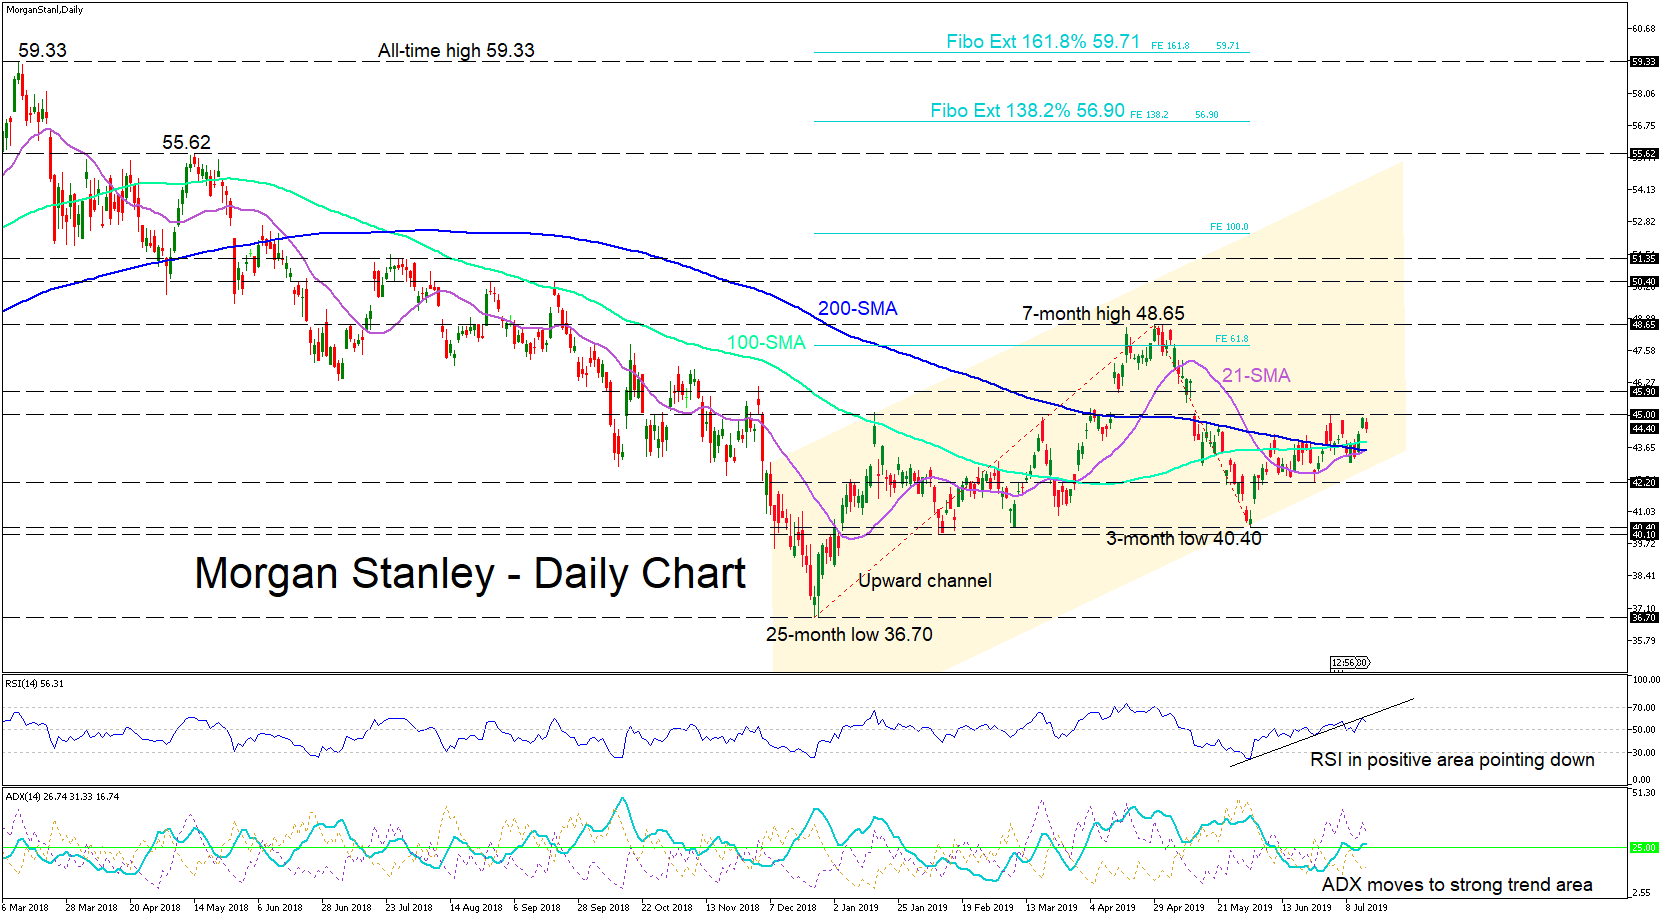
Technical Analysis – Morgan Stanley stock moves above 200-day simple moving average

Posted on July 16, 2019 at 9:30 am GMT

Morgan Stanleys’ stock has been incrementally following the north road since the end of December, and in the last month has risen from a three-month low of 40.40 to face the ultimate battle with the 200-day simple moving average (SMA). Presently, it is facing short-term resistance at the previous weeks’ break high above the 200-day hurdle of 45.00. Momentum cooled after the 200-day break, as also shown by the RSI as it points down in the positive area, whereas the [..]

post-image

Technical Analysis – CADJPY lacks direction in short and long terms

Posted on July 16, 2019 at 9:21 am GMT

CADJPY is hovering near the 50.0% Fibonacci retracement level of the downleg from 89.25 to 76.60. After the rebound on the two-year low of 76.60, the pair has been lacking direction, confirmed by the technical indicators. The RSI is flattening in the positive area, while the MACD is moving sideways near the trigger line. An advance above the 50.0% Fibonacci of 82.90 and the 83.25 resistance could open the door for bullish actions until the 61.8% Fibonacci region, which overlaps with [..]

Technical Analysis – GBPUSD lacks bullish signals near six-month lows

Posted on July 16, 2019 at 7:16 am GMT

GBPUSD returned to the red zone and near a key support area around 1.25 after attempting to recover during the past three sessions. Chances for a meaningful rally in the short-term are currently viewed as minimal as the market action continues to take place comfortably below the simple moving averages (SMA) and the Ichimoku cloud, while the RSI and the MACD are lacking a clear direction while in the bearish area. Should the bears clear the 1.25 barrier, the focus will shift immediately towards the six-month low of 1.2438. Breaking decisively below [..]

Risk Warning: Your capital is at risk. Leveraged products may not be suitable for everyone. Please consider our Risk Disclosure.