XM does not provide services to residents of the United States of America.

Technical Analysis

Technical Analysis – GBPUSD moves south towards 27-month low

Posted on July 23, 2019 at 6:20 am GMT

GBPUSD has declined considerably again after it failed to surpass the short-term moving averages from the beginning of the month. During the preceding week, cable reached a fresh more than two-year low of 1.2380 and touched the return line of the downward sloping channel. The negatively aligned Tenkan-sen line serves as a testament to the negative short-term momentum that is in place. The RSI indicator is moving south in the bearish territory, while the %K line of the stochastic oscillator [..]

post-image

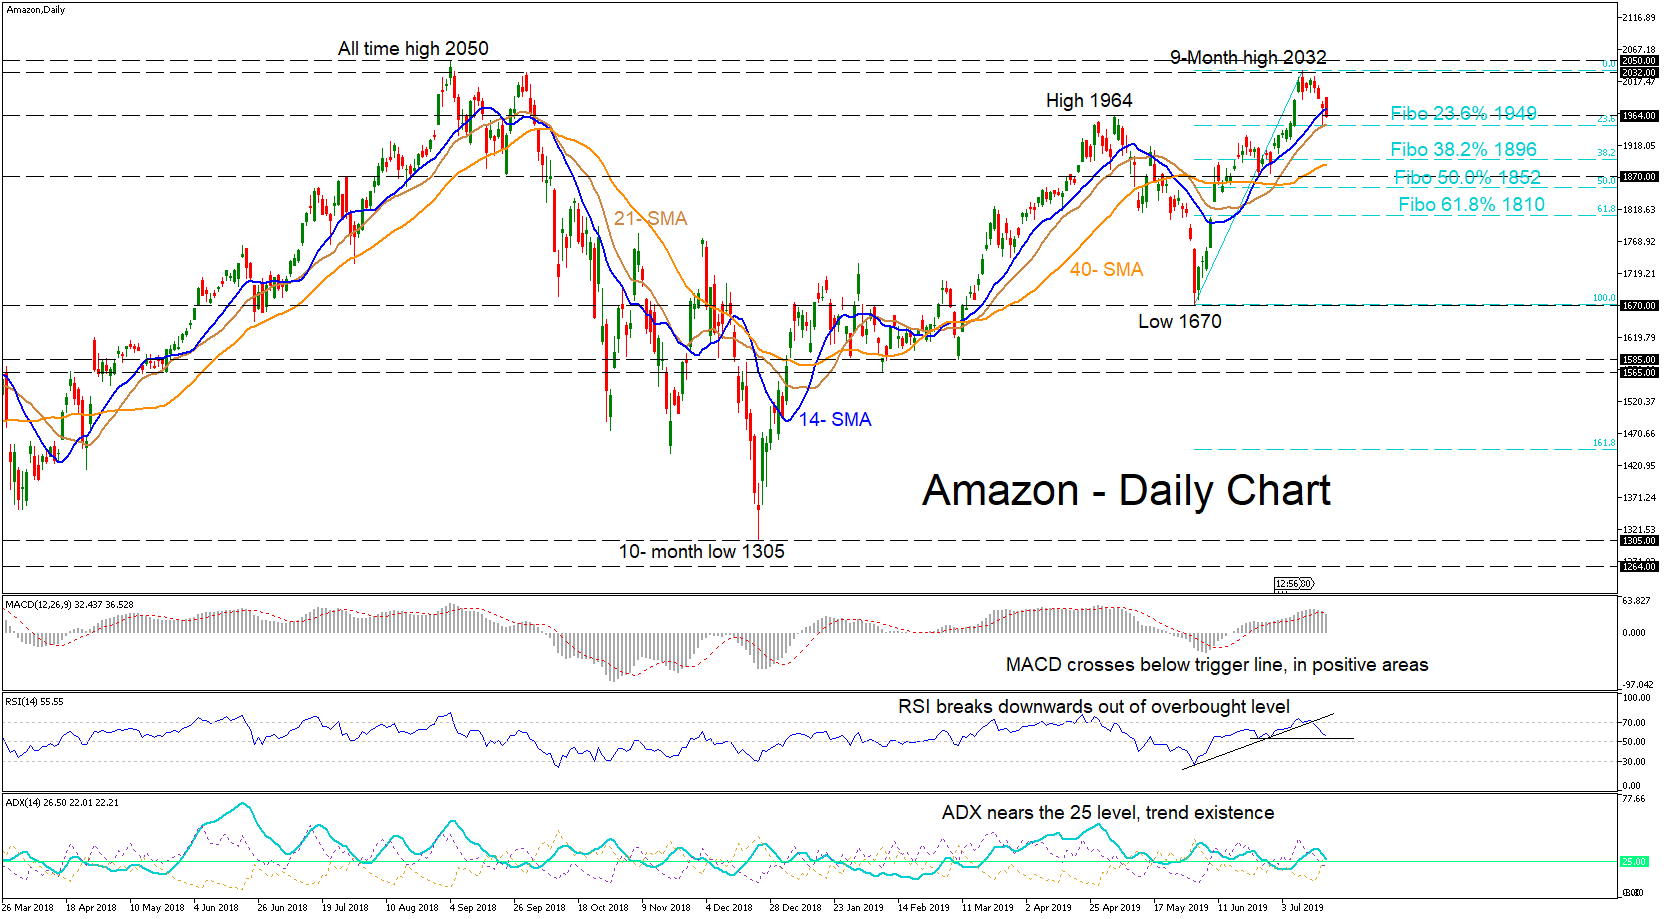
Technical Analysis – Amazon falls from 9-month high; forms hammer as it stalls at 23.6% Fibo

Posted on July 22, 2019 at 2:02 pm GMT

Amazon pulled away from a nine-month high of 2032 in the previous weeks, to halt yesterday at the 23.6% Fibonacci retracement level of the up move, from 1670 to 2032, of 1949. The 21-day simple moving average (SMA) is also very close and a hammer formation has taken shape, pushing the price above the resistance of 1964. The momentum indicators are suggesting that the sentiment may turn negative as the MACD has dived below its trigger line and RSI nears [..]

post-image

Technical Analysis – EURCAD ticks above 22-month low; looks oversold

Posted on July 22, 2019 at 1:22 pm GMT

EURCAD recovered slightly to the upside after it reached a fresh 22-month low around the 1.4600 psychological mark last week. However, the pair dived aggressively from the 1.4880 – 1.5210 trading range, extending bearish actions below the short-term moving averages in the daily timeframe. The RSI and the MACD are lacking direction as both are moving in negative area with weaker momentum than before, suggesting overstretched market. If the pair drops beneath the multi-month trough could move towards the strong [..]

post-image

Technical Analysis – ETHUSD struggles under 40-SMA with weak momentum

Posted on July 22, 2019 at 10:48 am GMT

ETHUSD has been moving with weak momentum over the last few sessions, remaining between the 20- and 40-simple moving averages (SMAs) in the 4-hour chart. Following the rebound on 187.63, the 61.8% Fibonacci retracement level of the upward wave from 80.00 to 362.045, the technical indicators are suggesting more gains to come ahead; the stochastic is positively sloped and below the overbought zone, while the MACD is extending its upward movement towards the zero line. In the event of an upside reversal, [..]

post-image

Technical Analysis – EURAUD hands on with the 200-SMA, joined by the uptrend line

Posted on July 22, 2019 at 10:05 am GMT

EURAUD descended from a five-and-a-half-month high of 1.6447, over a one-month period, to break through a double obstacle of the 200-day simple moving average (SMA) and the uptrend line from Feb 2017. Price stalled just below the 1.5900 psychological level, where buyers have come on board to try and move back north. The price has crossed downwards through the Ichimoku cloud and all simple moving averages. The 50- and 100-day (SMAs), although above the 200-SMA, have started to turn down, [..]

Technical Analysis – Gold bulls pause rally at fresh 6-year highs

Posted on July 22, 2019 at 8:21 am GMT

Gold spiked to a fresh six-year high of 1,453 on Friday after closing above the 50% Fibonacci of the three-year old downleg from 1,796 to 1,046, but the market could not sustain the gains, with the price pulling back near the Fibonacci level. Meanwhile in momentum indicators, the MACD failed to pierce its red signal line last week, while the RSI continues to fluctuate sideways in the bullish area, both suggesting a neutral-to-bearish bias for the short-term. The slowdown in the 20-day simple [..]

Technical Analysis – EURUSD hovers near 1.1200; maintains weak bias in near term

Posted on July 22, 2019 at 6:15 am GMT

EURUSD has been under pressure over the last three weeks as it failed several times to jump above the short-term simple moving averages (SMAs) and the 23.6% Fibonacci retracement level of the downleg from 1.1815 to 1.1106 near 1.1275. Short-term momentum indicators are pointing to a continuation of the bearish bias. The RSI bounced off the neutral threshold of 50 and is edging lower, while the MACD oscillator is strengthening its movement to the downside below trigger and zero lines. [..]

post-image

Technical Analysis – EURCHF creeps up to 23-month low; sellers push down below the border

Posted on July 19, 2019 at 1:51 pm GMT

EURCHF continued southbound from a 6-month high of 1.1475 on April 23, breaking out of an 8-month period sideways move to push towards a 23-month low of 1.1055. Presently, sellers are fracturing the support trying to continue the bearish bias. The 14-day simple moving average (SMA) is beginning a bearish cross of the 21-day SMA, whereas the long-term SMAs coincide with the down move. The MACD has crossed below the trigger line and the RSI approaches the 30 level, both in [..]

post-image

Technical Analysis – Gold drops after flying to more than 2-year high

Posted on July 19, 2019 at 11:21 am GMT

Gold advanced to a more than two-year high of 1,452.87 earlier today, but quickly reversed lower near the previous highs of 1,438. The technical indicators seem to be overstretched in the daily timeframe as the RSI is reversing lower after it touched the 70 level, while the MACD has found obstacle at the trigger line. If the price successfully surpasses the two-year high (1,452.87), it could prove a trigger point for another bullish round towards the 1,475 mark, registered on [..]

post-image

Technical Analysis – USDTRY pulls back from 4-month low; bearish in short term

Posted on July 19, 2019 at 9:34 am GMT

USDTRY has been in a downtrend over the last two months following the pullback on the seven-month high of 6.2440. The pair is holding beneath the 20- and 50-simple moving averages (SMAs), however, the momentum indicators are signaling for some gains in the short-term. The RSI is pointing marginally up in the negative zone, while the MACD posted a bullish crossover with its trigger line below the zero line. In case of another step lower and a penetration of the [..]

Risk Warning: Your capital is at risk. Leveraged products may not be suitable for everyone. Please consider our Risk Disclosure.