XM does not provide services to residents of the United States of America.

Technical Analysis

post-image

Technical Analysis – EURAUD recoups June-July losses; hits new 7-month high

Posted on August 5, 2019 at 2:46 pm GMT

EURAUD reclaimed the losses of the drop from the 1.6447 high on June 18 to a low of 1.5893 on July 23. The pair rallied with determination, printing eight positive candles and one negative, rising past a five-and-a-half-month high of 1.6447 to a new high, currently at 1.6530. The Tenkan-sen’s gradient implies a strong push up. The MACD has recently moved into the positive region and is above its red trigger line, showing momentum starting to increase in the move [..]

post-image

Technical Analysis – USDCHF aggressively breaks swing low; faces uptrend line

Posted on August 5, 2019 at 2:29 pm GMT

USDCHF spiked above the twice tested resistance of 0.9950 and the upper Bollinger band last week, to touch the 200-day simple moving average (SMA). The pair then tumbled through the 0.9900 level, which is the 38.2% Fibo of the down move from 1.0235 to 96.93, before continuing past the 50-, 20- and 14-day SMAs as well as the 0.9820 level, which is the 23.6% Fibo. Sellers then fractured the 0.9805 support and lower Bollinger band, before resting at the uptrend [..]

post-image

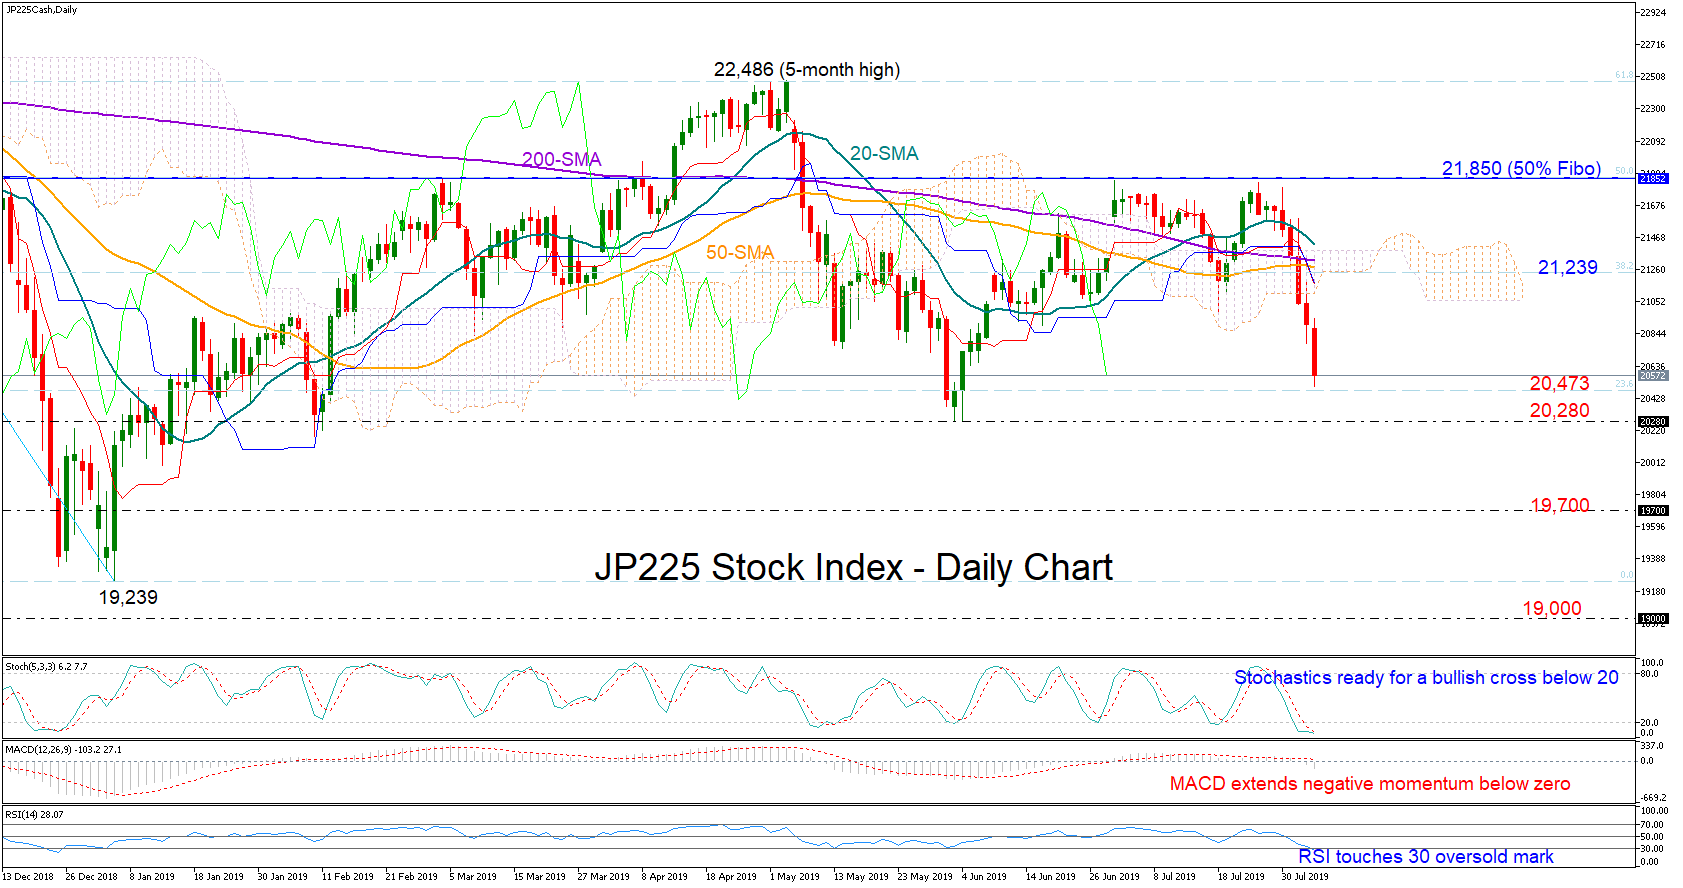
Technical Analysis – JP225 index slumps to oversold area; key support ahead

Posted on August 5, 2019 at 1:18 pm GMT

Japan’s 225 stock index has been unable to clear the heavy resistance around the 50% Fibonacci extension of the long donwleg from 24,472 to 19,239, with the price falling forcefully below its simple moving averages (SMA) and the Ichimoku cloud over the past week. The RSI and the Stochastics suggest that negative momentum could stall in the short-term as both indicators have slumped into oversold territory, but according to the MACD any price reversal may not last for long as the index seems to have [..]

post-image

Technical Analysis – USDCNH rocks to all-time highs; overbought warnings detected

Posted on August 5, 2019 at 10:19 am GMT

USDCNH skyrocketed above the symbolic 7.00 level on Monday and to all time-highs after breaking the crucial 6.960-6.980 ceiling that kept bulls under control more than three years now. Technically, some weakness could be reasonably awaited in the short-term as both the RSI and the Stochastics are currently flashing overbought. Still, with the MACD increasing positive momentum above its red signal line, any weakness could be manageable, especially if the market action holds above 6.96. If not, then the pair could head south [..]

Technical Analysis – Gold breaks upper boundary of trading range; prints new high

Posted on August 5, 2019 at 8:12 am GMT

Gold tested the 1400 hurdle for the third time over the last three weeks, and then rallied past the previous highs of 1437.58 and 1439.04 from July 3 and June 25. The metal then took a breather, and today moved above its six-year high of 1452.87, to produce a current new high of 1459.06. Although the 20- and 100-day simple moving averages (SMAs) are nearly parallel and flat, suggesting some neutrality, the 14-day SMA has broken above the 20-day SMA [..]

Technical Analysis – EURUSD bounces off 2-year lows but downside risks remain

Posted on August 5, 2019 at 7:29 am GMT

EURUSD switched to recovery mode after the free-fall towards a more-than-two-year low of 1.1026 last week. But the bearish forces have not faded yet as the RSI continues to move below 50 and the MACD under its red signal line despite showing some improvement. A closing price above 1.1180 and the 20-day simple moving average (SMA) (middle Bollinger band) could bring additional buying interest, with resistance running next up to the 1.1216-1.1232 area where the 50-day SMA is currently laying. Slightly higher, [..]

post-image

Technical Analysis – EURNOK rallies above previous swings plotting a week of positive sessions

Posted on August 2, 2019 at 1:55 pm GMT

EURNOK climbed fiercely this week taking back the rest of the losses which occurred from the move south that started the fall from the high of 9.8733 on May 10 to the low of 9.5810, including the high of 9.8733. The 20-day and the 40-day simple moving averages (SMAs) are turning and could cross above the 100-day SMA again to rejuvenate the up move. The momentum indicators confirm the bullish appearance suggested by the pair, as the MACD has crossed [..]

post-image

Technical Analysis – BTCUSD clears 100-EMA; bias cautiously bullish

Posted on August 2, 2019 at 1:45 pm GMT

Bitcoin propelled out of the Ichimoku cloud and above the 100 exponential moving average (EMA) in the four-hour chart, which proved hard to breach early in July. According to the RSI, the market seems to have reached overbought conditions and is likely to experience some weakness in the short-term as the indicator moves softly around its 70 overbought mark. However, if the MACD keeps gaining ground in the positive territory, the price may continue to head higher. An upturn above the July [..]

post-image

Technical Analysis – EURSEK reverses higher after forming triple bottom; meets resistance at upper Bollinger band

Posted on August 2, 2019 at 12:37 pm GMT

EURSEK rallied after breaking above the 200-day simple moving average (SMA) and the 23.6% Fibo retracement level of the down move from 10.8475 to 10.4845. The price of the pair continued its move breaching the 10.6230 and 10.6360 levels, which are the 38.2% Fibo and resistance from July 9, and completed a triple bottom reversal pattern. The price today jumped above 10.7090 which is the 61.8% Fibo, but sellers have come on board to try for a pullback. Momentum indicators [..]

Technical Analysis – USDJPY dives below 107; short-term bias turns bearish

Posted on August 2, 2019 at 10:30 am GMT

USDJPY came under severe selling pressure on Thursday, with the price quickly exiting the 109 area and sliding below the 107 level early on Friday. The momentum indicators are facing downside pressure as well, framing a bearish bias for the short-term trading. Yet with the RSI and the Stochastics moving closer to the oversold territory, any downfall could be limited. The 78.6% Fibonacci of 105.60 of the upleg from 104.64 to 112.39 could provide nearby support to additional losses. Any [..]

Risk Warning: Your capital is at risk. Leveraged products may not be suitable for everyone. Please consider our Risk Disclosure.