XM does not provide services to residents of the United States of America.

Technical Analysis

post-image

Technical Analysis – USDZAR records fresh 11-month high

Posted on August 20, 2019 at 3:21 pm GMT

USDZAR’s one-month rally up from the five-month low of 13.808 seems to have lost steam moving slightly sideways after recording an eleven-month high at 15.492. Despite the 50-, 100- and 200-period simple moving averages (SMAs) reflecting a bullish picture as they rise on the four-hour chart, the MACD and RSI warn of a possible short-term correction. Both are in positive regions with the MACD slightly below its trigger line while the RSI heads towards the neutral level. If the bulls pick [..]

post-image

Technical Analysis – USDSEK bulls take control and fracture 17-year high

Posted on August 20, 2019 at 12:52 pm GMT

USDSEK’s revived rally upwards from the 9.4925 low of August 14, saw the bulls take the reins to push the pair higher above a 17-year high of 9.6980. The Tenkan-sen average has steepened confirming the new move, whilst bullish signals also come from the 50-, 100- and 200-period simple moving averages (SMAs) as they rise on the four-hour chart. The MACD and the RSI concur with the apparent strength in positive directional momentum, as the MACD has moved above its [..]

post-image

Technical Analysis – USDCHF may retrace rebound in short-term

Posted on August 20, 2019 at 10:19 am GMT

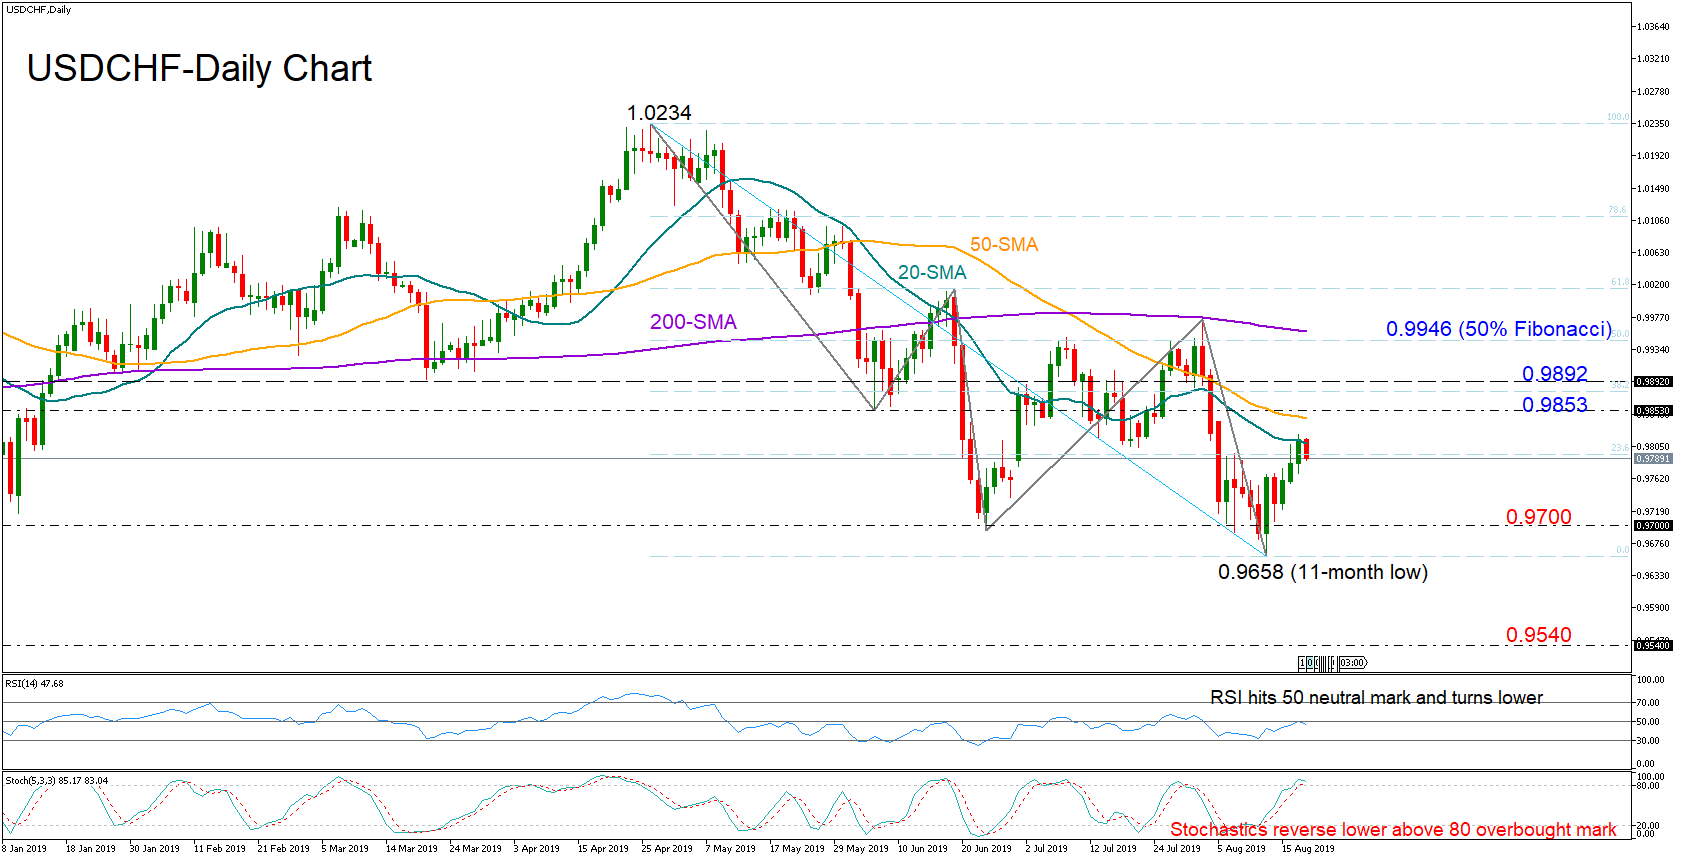
USDCHF rebounded from an 11-month low of 0.9658 last week to pierce the 20-day simple moving average (SMA) on Monday. Still, the momentum indicators suggest that the market may lose steam in the short-term as the RSI seems to be pulling back from its 50 neutral mark and the Stochastics are reversing lower in the overbought territory. On the way down, the bears could take a rest near the 0.9700 round-level before challenging the 0.9658 trough. If the decline continues, the downward pattern could [..]

post-image

Technical Analysis – GBPCHF enclosed by key Fibonacci boundaries; risk neutral-to-bearish

Posted on August 20, 2019 at 8:49 am GMT

GBPCHF has been hovering between the 23.6% and the 38.2% Fibonacci levels of the bearish move with a top at 1.2367 and a low at 1.1670 over the past two sessions. Technically, the sentiment may hold neutral-to-bearish in the short-term in the four-hour chart as the RSI is currently positioned around its 50 neutral mark and the MACD is deviating below its red signal line. Nevertheless, if the sellers manage to finish the session below the 23.6% Fibonacci of 1.1835 and comfortably under the [..]

Technical Analysis – WTI oil futures recent rally retests the 200-SMA

Posted on August 20, 2019 at 8:48 am GMT

WTI oil futures collapsed back down to the lower boundary of the nearly three-month trading range, registering a seven-month low of 50.51, before the bulls rallied back up to the 200-period simple moving average (SMA) on the four-hour chart. The MACD and the RSI are also indicating some weakness but suggest a positive directional momentum is still in place. They are both in the positive region with the MACD above its red trigger line and the RSI slowly creeping higher [..]

Technical Analysis – GBPUSD softens near 20-day SMA; bears to keep control

Posted on August 20, 2019 at 6:54 am GMT

GBPUSD has been softly rising since the day it tumbled to a new 31-month low of 1.2014 but the 20-day simple moving average (SMA) appeared somewhat restrictive on Monday, pushing the price a little bit lower. The MACD continues to improve above its red signal line, though with the RSI holding in bearish territory and the Tenkan-sen pointing downwards well under the blue Kijun-sen, the short-term risk remains skewed to the downside. Nearby resistance could be found between the 20-day SMA [..]

post-image

Technical Analysis – GER30 index closes above the 50-SMA and downtrend line

Posted on August 19, 2019 at 3:22 pm GMT

The GER30 index put in a rally, pushing upwards off the 11,266 low of August 15. The price surpassed 11,580, which is the 23.6% Fibo of the down leg from 12,600 to 11,266 and near the resistance of 11,607 from June 3. More importantly the appreciation of price moved above the 50-period simple moving average (SMA) and downtrend line to enter the Ichimoku cloud. Although the momentum indicators suggest a short-term positive directional trend in place, traders should be cautious [..]

post-image

Technical Analysis – US Dollar index pushes north again

Posted on August 19, 2019 at 12:57 pm GMT

The US dollar index moved north from the 100-day simple moving average (SMA) as buyers dominated, taking back most of the losses produced from the high of 98.67 on August 1. The price has come to settle above 97.90, which is the 23.6% Fibonacci retracement level of the up-leg from 95.34 to 98.67, and slightly below the May peak of 98.23. The momentum indicators are reflecting a bullish bias as the MACD is ascending again above its red trigger line [..]

post-image

Technical Analysis – US500 index grows bullishly; eyes 2,940 resistance

Posted on August 19, 2019 at 11:15 am GMT

The US 500 stock index (cash) is looking increasingly positive in the short term, having surpassed its 50-period simple moving average (SMA) and the Ichimoku cloud and given the positive direction in the RSI and the MACD. The bulls, however, may need to lift the index above the 2,940 barrier to confirm further upside, while a significant break above the 200-period SMA (2,960) may increase buying interest towards the 3,000 level. Should the price retreat below the cloud, traders could search for immediate [..]

Technical Analysis – Gold slips below 50-SMA; risk leans towards negative

Posted on August 19, 2019 at 8:57 am GMT

Gold has only been focused on making new peaks as it logged a new 6-year and four-month high of 1534.91. The metal corrected to the downside after the high on August 13 but the 50-period simple moving average (SMA) in the four-hour chart managed to limit the negative movement. The MACD and the RSI are indicating that the positive directional momentum is decreasing as the MACD is underneath its red trigger line, nearing zero, whereas the RSI has moved slightly [..]

Risk Warning: Your capital is at risk. Leveraged products may not be suitable for everyone. Please consider our Risk Disclosure.