XM does not provide services to residents of the United States of America.

Technical Analysis

post-image

Technical Analysis – Netflix stock collapses out of a 3-month trading range

Posted on August 30, 2019 at 2:22 pm GMT

Netflix stock plummeted out of a three-month sideways market breaching the lower boundary of 335.88, where the 200-day SMA also happened to lie. The stocks’ one-and-a-half-month plunge which started July 11, had the price retrace to around 287.09, slightly below 290.15, which is the 61.8% Fibonacci retracement level of the up leg from 230.78 to 386.00. The MACD suggests an increase in positive directional momentum as it has moved above its red trigger line in the negative zone. The RSI [..]

post-image

Technical Analysis – EURNZD completes an asymmetrical triangle

Posted on August 30, 2019 at 1:34 pm GMT

EURNZD is likely to extend the sideways move in the short-term until it completes the asymmetrical triangle in the four-hour chart, with the RSI and the MACD backing this view as well as the indicators are lacking clear direction. The positive slope in the 20-period simple moving average (SMA) that recently crossed above the 50-period SMA suggests that the upward pattern will stay in place in the short-term. Should the price crawl above the triangle and the 1.7571 ceiling, the market could attract fresh buying interest, [..]

post-image

Technical Analysis – Apple uptrend loses steam, may turn neutral soon

Posted on August 30, 2019 at 1:18 pm GMT

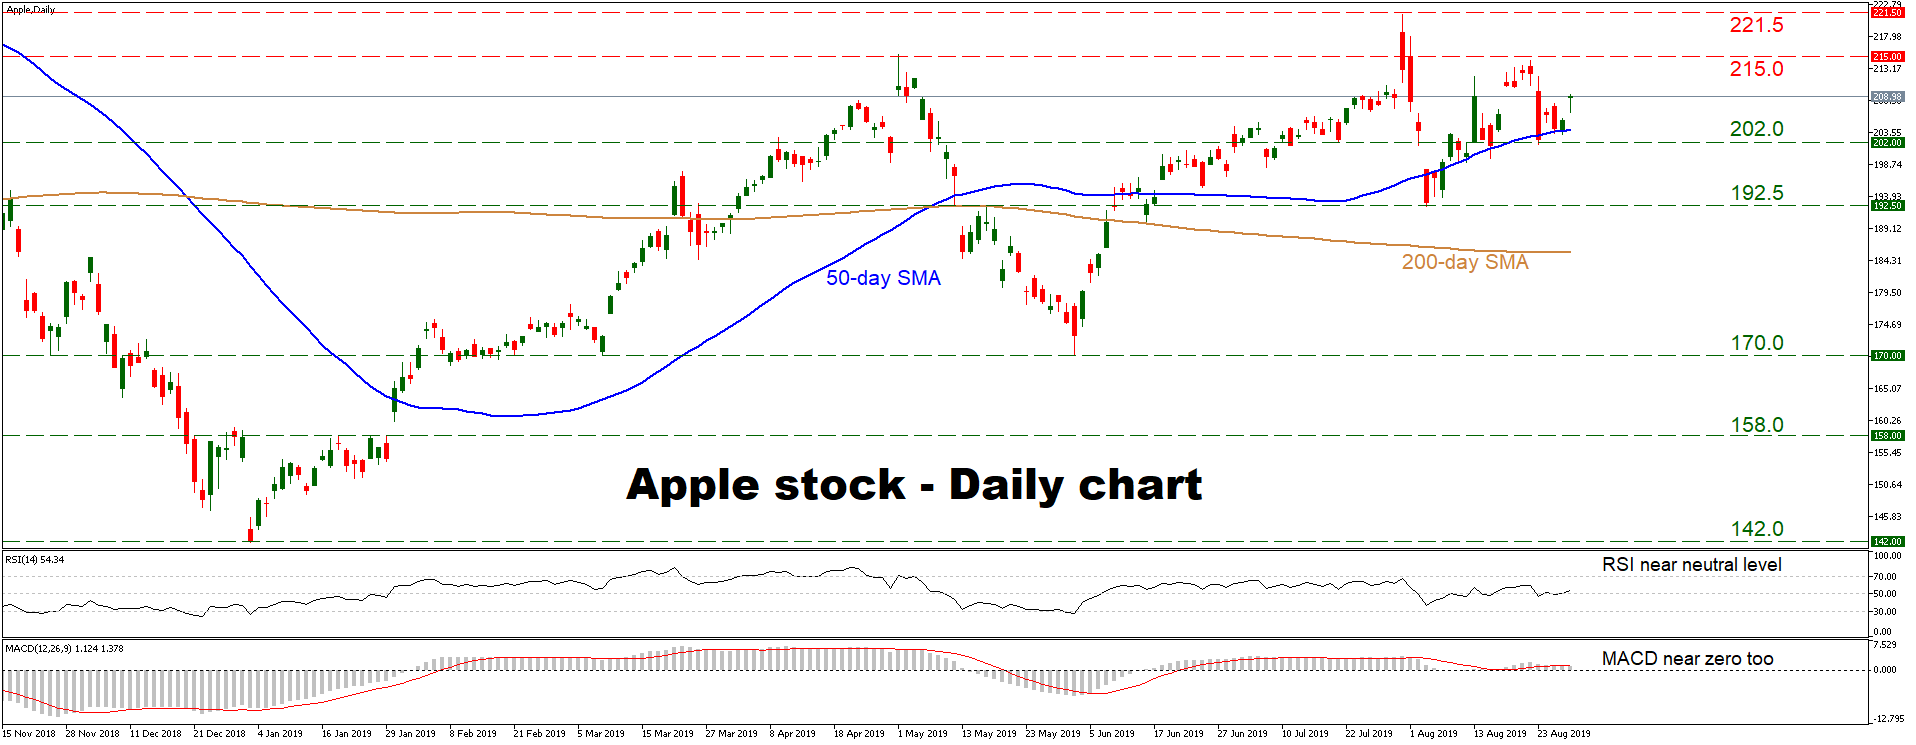
Apple’s stock touched a multi-month high at 221.5 at the end of July, but the price has retreated since then and recorded a lower high on the daily chart. This is an indication that the bigger uptrend may be losing steam. For the uptrend to resume, the bulls would need to push above 221.5. Short-term momentum oscillators are near their neutral levels, providing no clear directional signals. If buyers retake the driver’s seat, they may push towards 215.0 initially, this [..]

post-image

Technical Analysis – LTCUSD still in a bearish hangover; crosses under 200-day SMA

Posted on August 30, 2019 at 12:26 pm GMT

LTCUSD (Litecoin), the fifth largest cryptocurrency by market cap, turned on a slippery road after hitting a one-year high of 143.61 in June, with the price crossing below the Ichimoku cloud, and recently under the 200-day simple moving average (SMA). The bearish cross of the 20- and the 50-day SMAs is more evidence that the downward pattern may stay in place for longer. Although the RSI is located in the oversold territory, the indicator has yet to show any sign [..]

post-image

Technical Analysis – AUDJPY consolidates near 10-year lows

Posted on August 30, 2019 at 11:54 am GMT

AUDJPY fell to a fresh 10-year low of 69.90 earlier this week, before rebounding somewhat to re-enter the sideways range between 72.90 and 70.70 that it had been trading in since early August. The price structure still points to a clear downtrend, though a clear move below 69.90 is needed to signal that the consolidation phase is over and that the negative bias is back in force. Momentum oscillators paint a mixed picture, with the RSI still in bearish territory [..]

Technical Analysis – USDCAD trapped by SMAs near 50.0% Fibonacci; 1.3345 resistance endures

Posted on August 30, 2019 at 11:05 am GMT

USDCAD has been unable to overcome the 1.3345 barrier, despite breaching the 200-day simple moving average (SMA). The 1.3345 resistance is showing resilience as it was tested multiple times over the last two-weeks of consolidation. The price is slightly above the Ichimoku cloud between the 100- and 200-day SMAs increasing the odds that the sideways move may outstretch a while longer. Regarding momentum, the MACD is in positive territory and has moved below its red trigger line, reflecting weakening upside [..]

Technical Analysis – USDCHF bulls could become energized above Ichimoku cloud

Posted on August 30, 2019 at 7:27 am GMT

USDCHF inched up to test the 38.2% Fibonacci of the upleg from 1.0234 to 0.9658 after closing above the 50-day simple moving average (SMA) on Thursday. In momentum indicators, the RSI has entered bullish territory and is pointing up, while the MACD has further deviated above its red signal line and closer to zero. Both measures are therefore signalling a stronger bullish bias for the short-term. Nevertheless, traders could wait for a determined exit from the Ichimoku cloud, that blocked the [..]

post-image

Technical Analysis – EURNOK bulls attempt another push above 2018 high

Posted on August 29, 2019 at 3:24 pm GMT

EURNOK printed a new high of 10.0947 on August 7, but the bears took control and denied the two-week aggressive rally further gains, pulling the pair into a three-week sideways move. The simple moving averages (SMAs) are reflecting that more positive gains are likely to unfold, especially as the bulls take another go at climbing above the 2018 high of 10.0550, finding support from the 21-day SMA. The momentum indicators agree with the positive directional outlook. The MACD although below [..]

post-image

Technical Analysis – BTCUSD breaks symmetrical triangle to the downside

Posted on August 29, 2019 at 2:55 pm GMT

BTCUSD (Bitcoin) breached a symmetrical triangle to the downside on Wednesday in the four-hour chart and plunged to the 9,300 support-area – a negative trend signal. The fast-Stochastics and the RSI signal, however, have bottomed in the oversold territory and are turning higher, hinting that a rebound may be around the corner. A move northward could initially pause around the 9,680 barrier and then somewhere between the 23.6% Fibonacci of 10,130 of the downleg from 13,809 to 9,011 and the [..]

post-image

Technical Analysis – EURJPY rebounds from 2½-year low, but picture still negative

Posted on August 29, 2019 at 2:50 pm GMT

EURJPY hit a new 2½-year low earlier this week at 116.55 but found fresh buy orders and recovered a small portion of its losses. That said, the broader outlook remains negative as the price structure still consists of lower highs and lower lows, while the pair is also trading well below its 50- and 100-day simple moving averages (SMAs). Short-term momentum oscillators suggest that the current rebound may continue for now. The RSI – although in bearish territory – is [..]

Risk Warning: Your capital is at risk. Leveraged products may not be suitable for everyone. Please consider our Risk Disclosure.