XM does not provide services to residents of the United States of America.

Technical Analysis

post-image

Technical Analysis – EURCHF’s buyers correct to the 23.6% Fibonacci level

Posted on September 10, 2019 at 12:50 pm GMT

EURCHF, after a four-month decline, had bulls emerge to propel the price upwards to the 1.0970 resistance looking for further gains. The level is the 23.6% Fibonacci retracement of the down move from 1.1475 to 1.0810, and where the 50-day simple moving average (SMA) currently lies. Failing to breach, the current stalling price at the 23.6% Fibo of 1.0970, coupled with the downward sloping SMAs, suggests that the rally higher may be off the table for now. Additionally, the MACD [..]

post-image

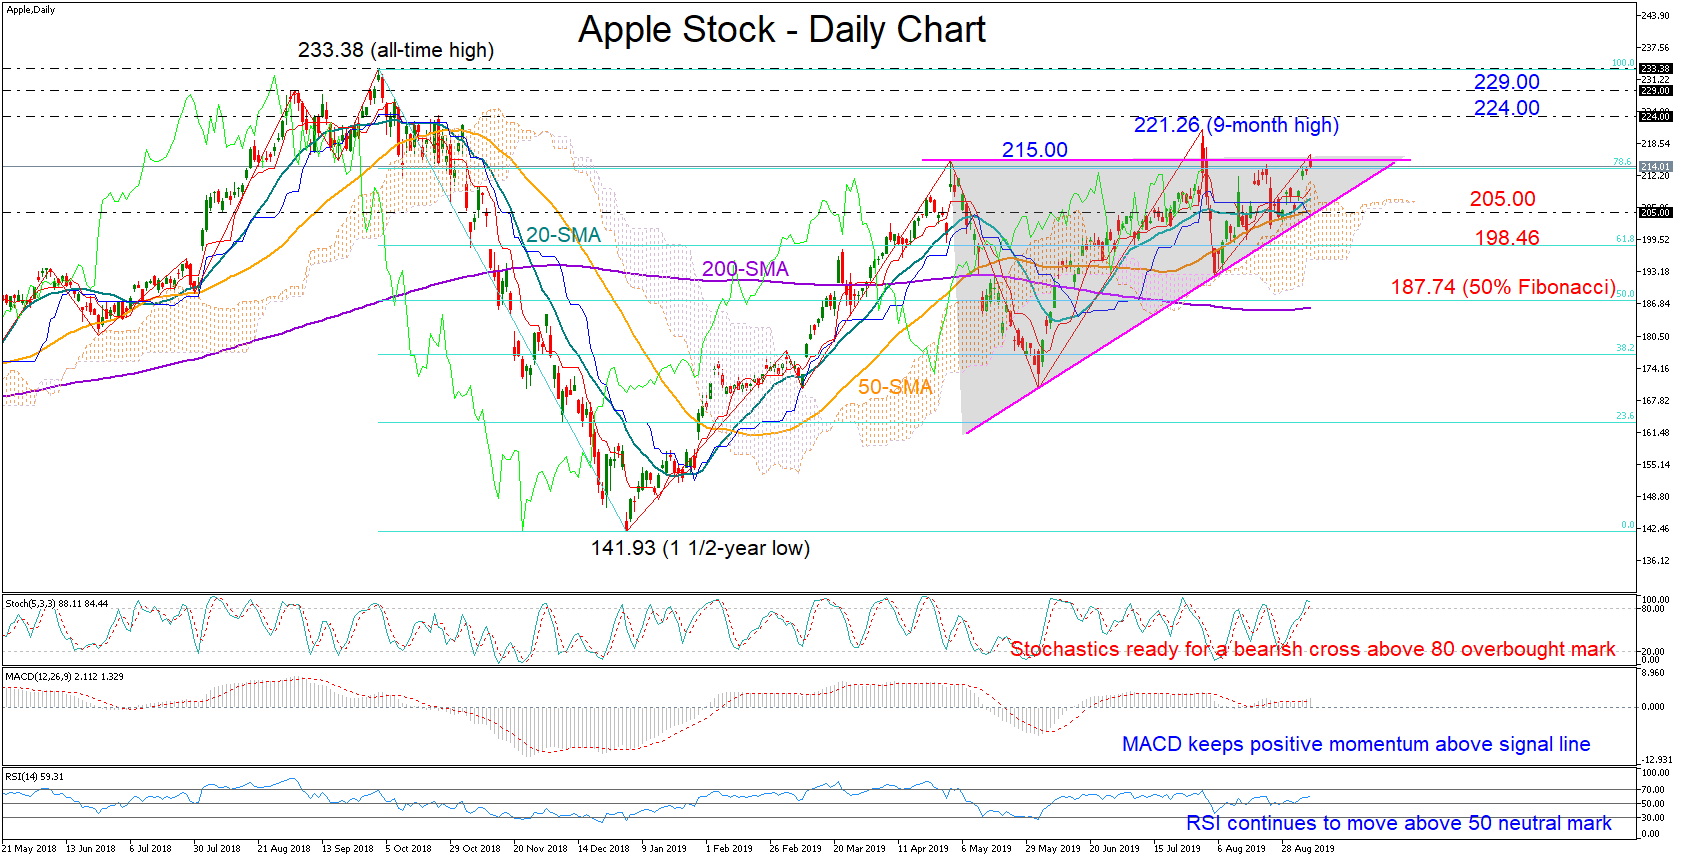
Technical Analysis – Could Apple stock break out of asymmetrical triangle ahead of products launch?

Posted on September 10, 2019 at 10:18 am GMT

Apple stock is edging higher ahead of the anticipated unveiling of new products later on Tuesday, including an updated iPhone. The company’s share price is trading around the upper boundary of an asymmetrical triangle and although the RSI and the MACD both reflect a bullish bias, the Stochastics are ready to print a bearish cross above the 80 overbought mark, signaling that a downside correction could be around the corner. Should the bulls close comfortably above the 215.00 ceiling and hence [..]

Technical Analysis – GBPUSD bulls trying to gain ground as 50-SMA breached

Posted on September 10, 2019 at 9:43 am GMT

GBPUSD met a roadblock at 1.2380 after a recent one-week drive up from a thirty-one-month low of 1.1957. The price climbed above the 50-day simple moving average (SMA) and the 1.2293 resistance, which is the 23.6% Fibonacci retracement level of the down move from 1.3381 to 1.1957. Dwindling positive momentum suggests that the price could adopt a short-term sideways approach as the MACD has risen slightly above zero into the positive territory, after distancing itself from its red trigger line, [..]

Technical Analysis – EURGBP violates key borders; bearish near oversold zone

Posted on September 10, 2019 at 7:27 am GMT

EURGBP registered losses for the fourth consecutive week and bearish signals became stronger as the price failed to return above the upward support line, crossing instead under its shorter-term simple moving averages (SMA) and the Ichimoku cloud. The 50% Fibonacci of the upleg from 0.8470 to 0.9323 managed to confidently curb downside movements on Monday and although the Stochastics are currently preparing to exit the oversold territory, the short-term bias remains skewed to the downside as the MACD maintains negative momentum under its red signal [..]

post-image

Technical Analysis – AUDJPY extends correction, flirts with 50-SMA

Posted on September 9, 2019 at 3:43 pm GMT

AUDJPY plotted five days of gains after a four-month decline to a 10 1/2-year low of 69.94. The bulls are currently facing some downside pressure from the 50-day simple moving average (SMA) as well as the near downtrend line. The indicators are reflecting an increasing bullish momentum, with the MACD rising in negative territory, distancing itself above its red trigger line, while the upward sloping RSI has inclined into bullish areas. If the bulls manage to surpass the 50-day SMA [..]

post-image

Technical Analysis – USDMXN bears gather ammunition below the 200-SMA

Posted on September 9, 2019 at 2:39 pm GMT

USDMXN slashed in half the gains it earned from July 31 in four days, with the price diving under the eight-month peak of 20.251 and through all the simple moving averages (SMAs) and the Ichimoku cloud. The technical indicators are suggesting a revival of the down move, with the MACD falling back beneath its trigger in negative territory and the RSI pointing downwards below its 30 oversold mark. More importantly the 42-period SMA seems to be headed for a bearish [..]

post-image

Technical Analysis – GBPCHF searches for more gains above 50-day SMA

Posted on September 9, 2019 at 1:07 pm GMT

GBPCHF is looking for more buyers to sign up in the short-term as the MACD tries to grow in the positive territory for the first time since April and the RSI is picking up steam in the bullish area. The market is currently making efforts to pierce July’s troughs around 1.2238, though only a bullish explosion above the previous high of 1.2367 would bring the four-month old downtrend in speculation. A step above 1.2535, which is the 50% Fibonacci of [..]

post-image

Technical Analysis – US500 index exits neutral zone to look at 3,000

Posted on September 9, 2019 at 12:03 pm GMT

The US 500 stock index (cash) is eyeing the 3,000 mark again after the violation of the tough 2,940 resistance-turned-support level put the market back into the bullish game. Yet, traders could reduce buying exposures in the short-term as the RSI signals overbought conditions for the fourth consecutive day and the MACD loses momentum below its red signal line. It is also worth noting that the 50- and the 200-period simple moving averages in the four-hour chart have already established a golden cross [..]

Technical Analysis – EURUSD pullback denied by bears and 50.0% Fibonacci level

Posted on September 9, 2019 at 9:24 am GMT

EURUSD plotted a twenty-eight-month low of 1.0925 after a fall from June 25. The bulls tried for a correction up to the downtrend line, but their efforts were ceased by the 20-day simple moving average (SMA) and the 50.0% Fibonacci retracement level of the down leg from 1.1249 to 1.0925, of 1.1086. The sellers took control at the level and pushed down the price, rejuvenating the prior downward sentiment. The momentum indicators are signaling that the down move could pause [..]

Technical Analysis – Gold unable to lift 1,560 barrier; upward channel sustains confidence

Posted on September 9, 2019 at 7:32 am GMT

Gold gave up some ground after failing to cross the 1,560 border, with the sellers currently eyeing the 1,493 noisy support area as the technical indicators warn over a neutral-to-bearish session in the short-term; the RSI is attached at its 50 neutral mark following last week’s decline and the MACD continues to lose momentum below its red signal line. The market, however, keeps a positive trend inside an ascending channel and unless the price breaches it on the way down, any weakness could [..]

Risk Warning: Your capital is at risk. Leveraged products may not be suitable for everyone. Please consider our Risk Disclosure.