XM does not provide services to residents of the United States of America.

Technical Analysis

Technical Analysis – GBPUSD pauses rally at 1.2500; bearish signals are not convincing yet

Posted on September 17, 2019 at 7:32 am GMT

GBPUSD had a weak start to the week as the 1.2500 level did not allow Friday’s big rally, that ended above the Ichimoku cloud, to continue. The price is currently located lower around 1.2400, with the falling RSI warning over a softer trading tone in the short-term. Yet, as far as the indicator holds above its 50 neutral mark and the red Tenkan-sen maintains a steep positive slope above the blue Kijun-sen, those signals are not enough to convince that negative momentum [..]

post-image

Technical Analysis – Palladium futures push to a new all-time peak

Posted on September 16, 2019 at 3:21 pm GMT

Palladium futures plotted a new all-time high of 1617.03 as the bulls surpassed the previous peaks from March 21 and July 11. However, the sellers have emerged and have frozen all short-term efforts of a climb higher, something which is also reflected in the momentum indicators. The MACD although in positive areas and above its trigger line, has flattened out, while the RSI has deflected off the 70-level and heads down. Despite this, the bigger positive picture from the simple [..]

post-image

Technical Analysis – Brent futures soar, logging biggest intraday gains

Posted on September 16, 2019 at 2:42 pm GMT

Brent crude oil today gapped higher, propelling the commodity to levels not seen for three-and-a-half months. The price soared by 6.51 at the opening to reach a peak of 68.49, before black gold retraced down to 64.81, surrendering some of its gains. Yet, the bulls have resurfaced and revived the move up back above 65.52, which is the 23.6% Fibonacci retracement level of the up leg from 55.87 to 68.49. The momentum indicators reflect a short-term positive picture, as the [..]

post-image

Technical Analysis – GBPCAD prints biggest daily gain in two years

Posted on September 16, 2019 at 12:05 pm GMT

GBPCAD recorded its biggest daily gain in more than two years on Friday, with the pair rallying by 2.0% to find resistance around 1.6610, which is the 38.2% Fibonacci of the downleg from 1.7793 to 1.5873 – a key support area during 2018. Although the market opened lower on Monday, the bullish pressure remains strong as the MACD keeps increasing momentum above its signal line and the RSI holds well above its 50 neutral level despite slowing a little bit. The Stochastics, though, have [..]

post-image

Technical Analysis – USDNOK uptrend is under pressure; short-term bias neutral-to-bearish

Posted on September 16, 2019 at 11:08 am GMT

USDNOK has created a lower low around 8.910 and a lower high at 9.010, putting its upward pattern that topped at a multi-year high of 9.162 into speculation. The 50-period simple moving average (SMA) in the four-hour chart is heading for a bearish cross with the 200-period SMA, signaling that a resumption of the positive trend may be difficult to be achieved. Meanwhile, in momentum indicators, the RSI and the MACD suggest that the next move in the price may [..]

Technical Analysis – Gold retraces to 23.6% Fibonacci; bounces off uptrend line

Posted on September 16, 2019 at 9:47 am GMT

Gold bounced off the uptrend line drawn from May 30, gapping above the 21-period simple moving average (SMA) and then was halted by the 50-period SMA. The metal had consolidated around the 1488 level, which is the 23.6% Fibonacci retracement of the up leg from 1266.20 to 1556.92, after dropping from a recent seventy-seven-month high of 1556.92 on September 4. The 100-period SMA has flattened suggesting the sideways move may extend. While also neutral, the MACD, just below the zero [..]

Technical Analysis – EURUSD trapped under resistance trend-line

Posted on September 16, 2019 at 7:12 am GMT

EURUSD managed to quickly recover from 28-month lows last week but once again the bulls did not have the strength to close above the down-trending line drawn from the 1.1411 peak. The short-term bias is now looking neutral-to-bearish as the RSI eases momentum marginally below its 50 neutral mark and the red Tenkan-sen is stabilizing well under the blue Kijun-sen line. For a meaningful rally, buyers need to snap the descending trend-line seen around 1.1100 and particularly close above the 50-day simple moving average [..]

post-image

Technical Analysis – AUDNZD bulls break above 5-month high

Posted on September 13, 2019 at 1:34 pm GMT

AUDNZD breached the five-month high from April 17, after plotting gains in a rally that commenced on August 6. The indicators are reflecting an increase in positive directional momentum. The MACD has re-inclined above its red trigger line in the positive region, while the upward sloping RSI crosses into overbought territory. Further endorsing the view, the 21-day simple moving average (SMA) has distanced itself above the 50-day SMA, while the 50-day SMA itself approaches a bullish cross of the 100-day [..]

post-image

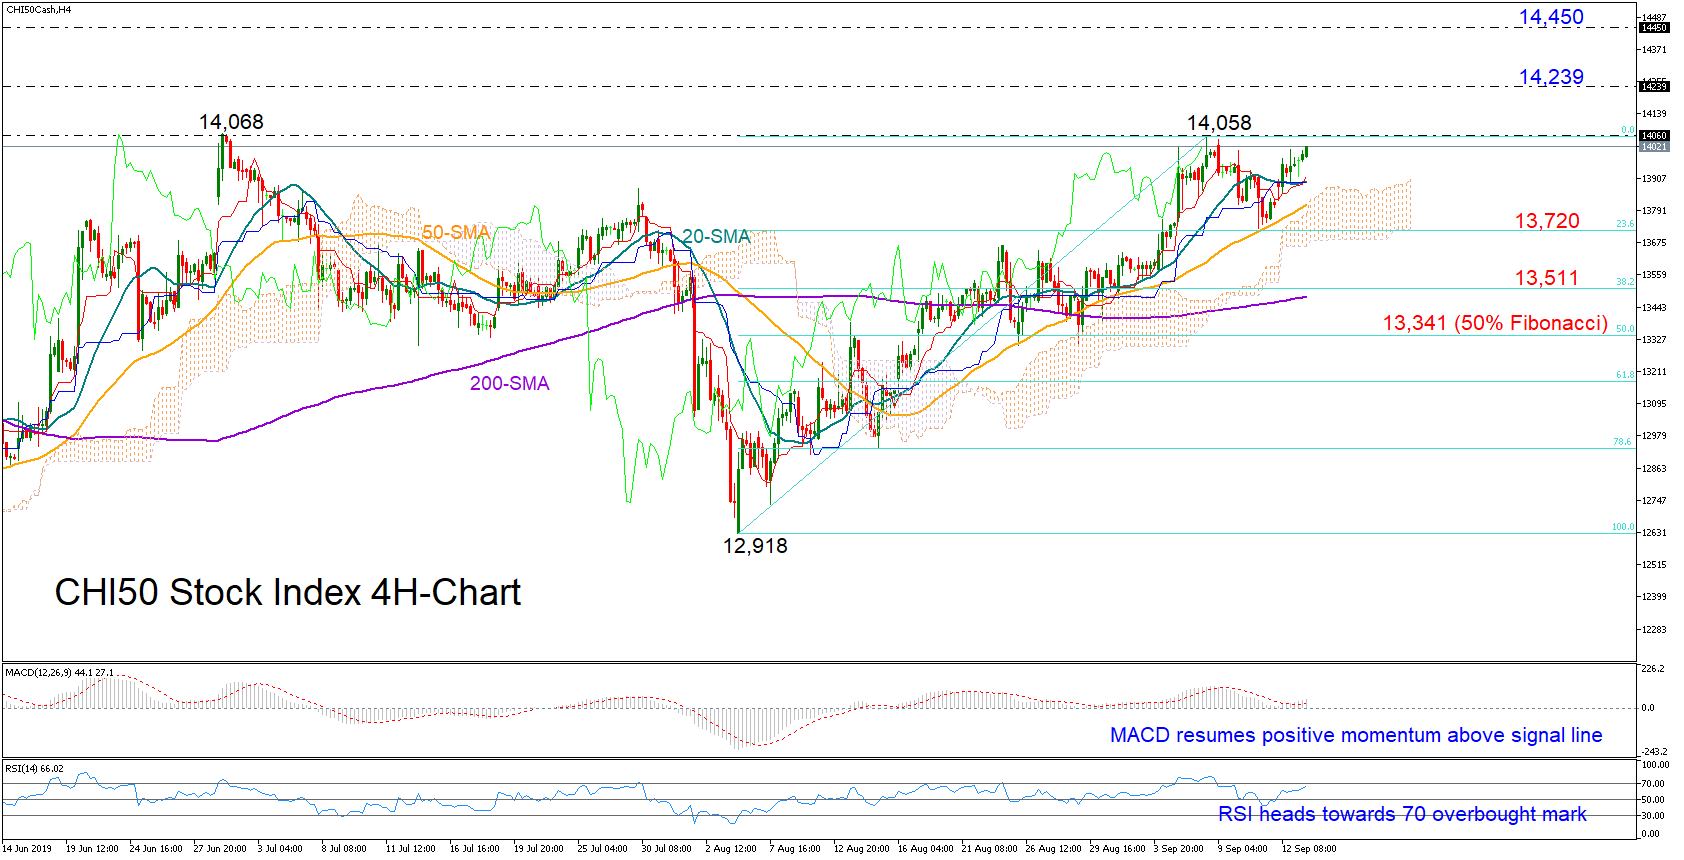
Technical Analysis – CHI50 index set for more upside; strong resistance around 14,060

Posted on September 13, 2019 at 12:34 pm GMT

China’s 50 stock index (CHI50)  made a U-turn near the 50-period simple moving average (SMA) in the four-hour chart and is building momentum to reclaim strong resistance around 14,060. According to the RSI and the MACD there is more upside in store as both indicators point upwards in the bullish area, while in Ichimoku indicators, the red Tenkan-sen is ready to surpass the blue Kijun-sen line, embracing the positive spirit as well. It is also worth mentioning that the RSI [..]

post-image

Technical Analysis – USDCAD forced back below the 200-SMA & 100-SMA

Posted on September 13, 2019 at 9:42 am GMT

USDCAD bulls shot above the 200-day simple moving average (SMA) on September 3, but it seems that the bullet was a dud. The bears reversed underneath the 1.3355 resistance, which is the 61.8% Fibonacci retracement level of the down move from 1.3564 to 1.3015, and more importantly the 200- and 100-day SMAs. It seems like a cease fire is developing, as the SMAs and the Kijun-sen are adopting a horizontal picture, with buyers driving back into the Ichimoku cloud. The [..]

Risk Warning: Your capital is at risk. Leveraged products may not be suitable for everyone. Please consider our Risk Disclosure.