XM does not provide services to residents of the United States of America.

Technical Analysis

post-image

Technical Analysis – Palladium futures climb higher; plot new all-time high

Posted on September 23, 2019 at 1:01 pm GMT

Palladium futures are logging new peaks after the tables turned on the bears on September 18, following three negative daily sessions from the recent high of 1617. The metal seems to have new life injected into the push higher, something also backed by the inclining simple moving averages (SMAs). Positive momentum has picked up with the thrust up to uncharted territory as the MACD continues to rise in the bullish area and above its red trigger line. The RSI has [..]

post-image

Technical Analysis – US100 uptrend in consideration after lower high

Posted on September 23, 2019 at 12:44 pm GMT

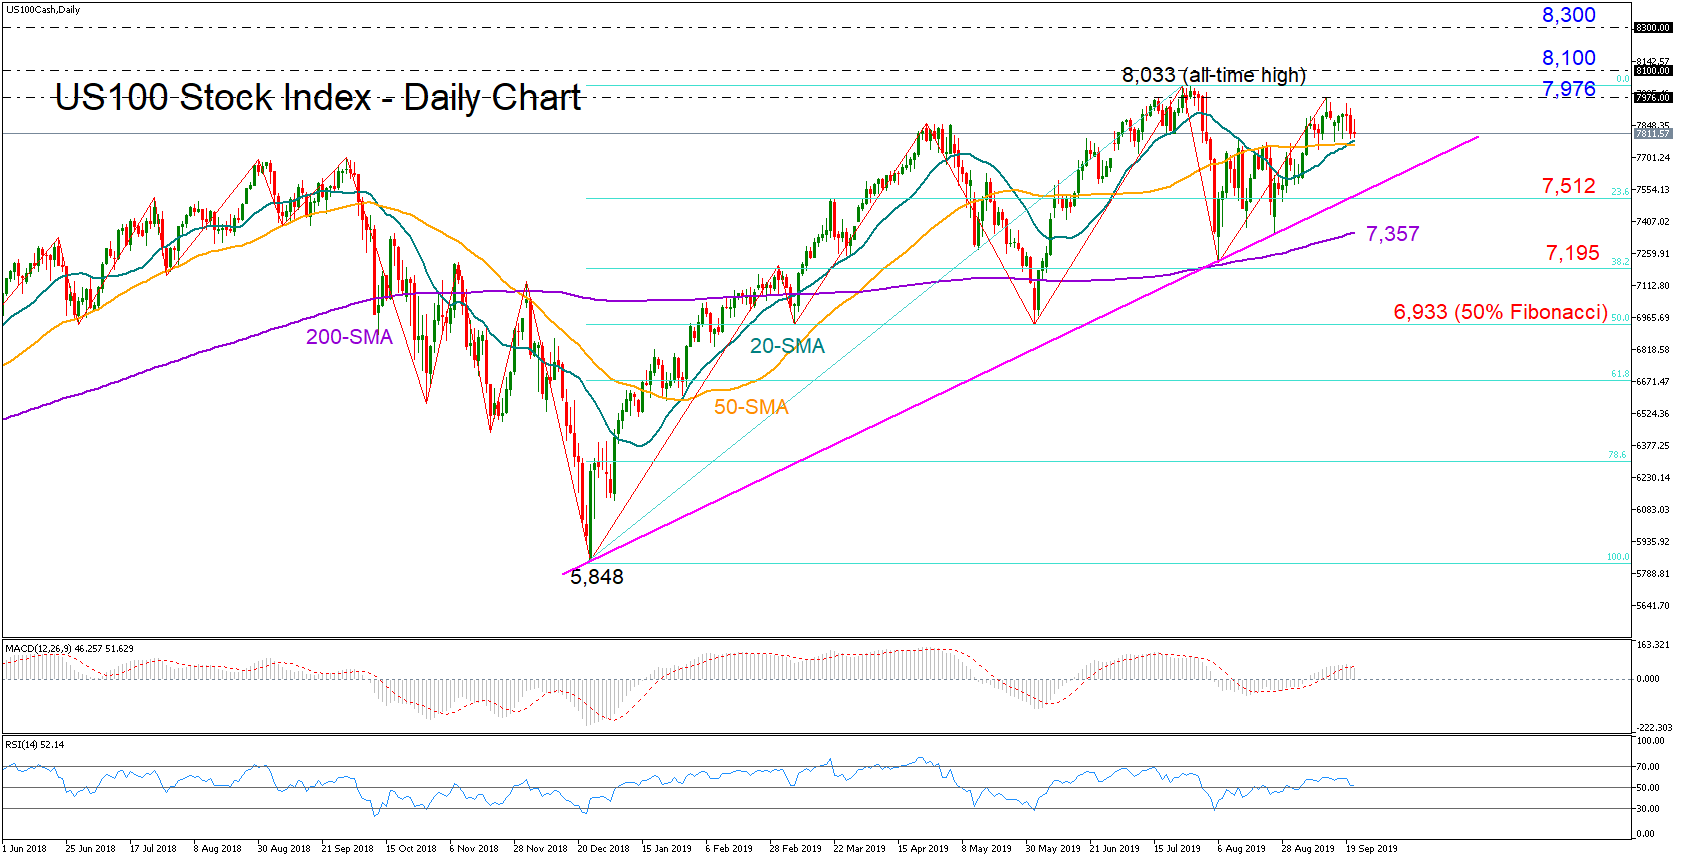
US100 stock index is keeping its higher lows connected with an ascending trend-line drawn from the end of December, but the lower high registered at 7,976 earlier this month has brought some doubt about whether the market will stretch its uptrend to a new record high anytime soon. The momentum indicators are currently reducing the odds for such a case as the MACD seems to be making its way down under its red signal line and the RSI has reversed back towards [..]

post-image

Technical Analysis – GER30 index supported by Ichimoku cloud after bearish breakout

Posted on September 23, 2019 at 10:04 am GMT

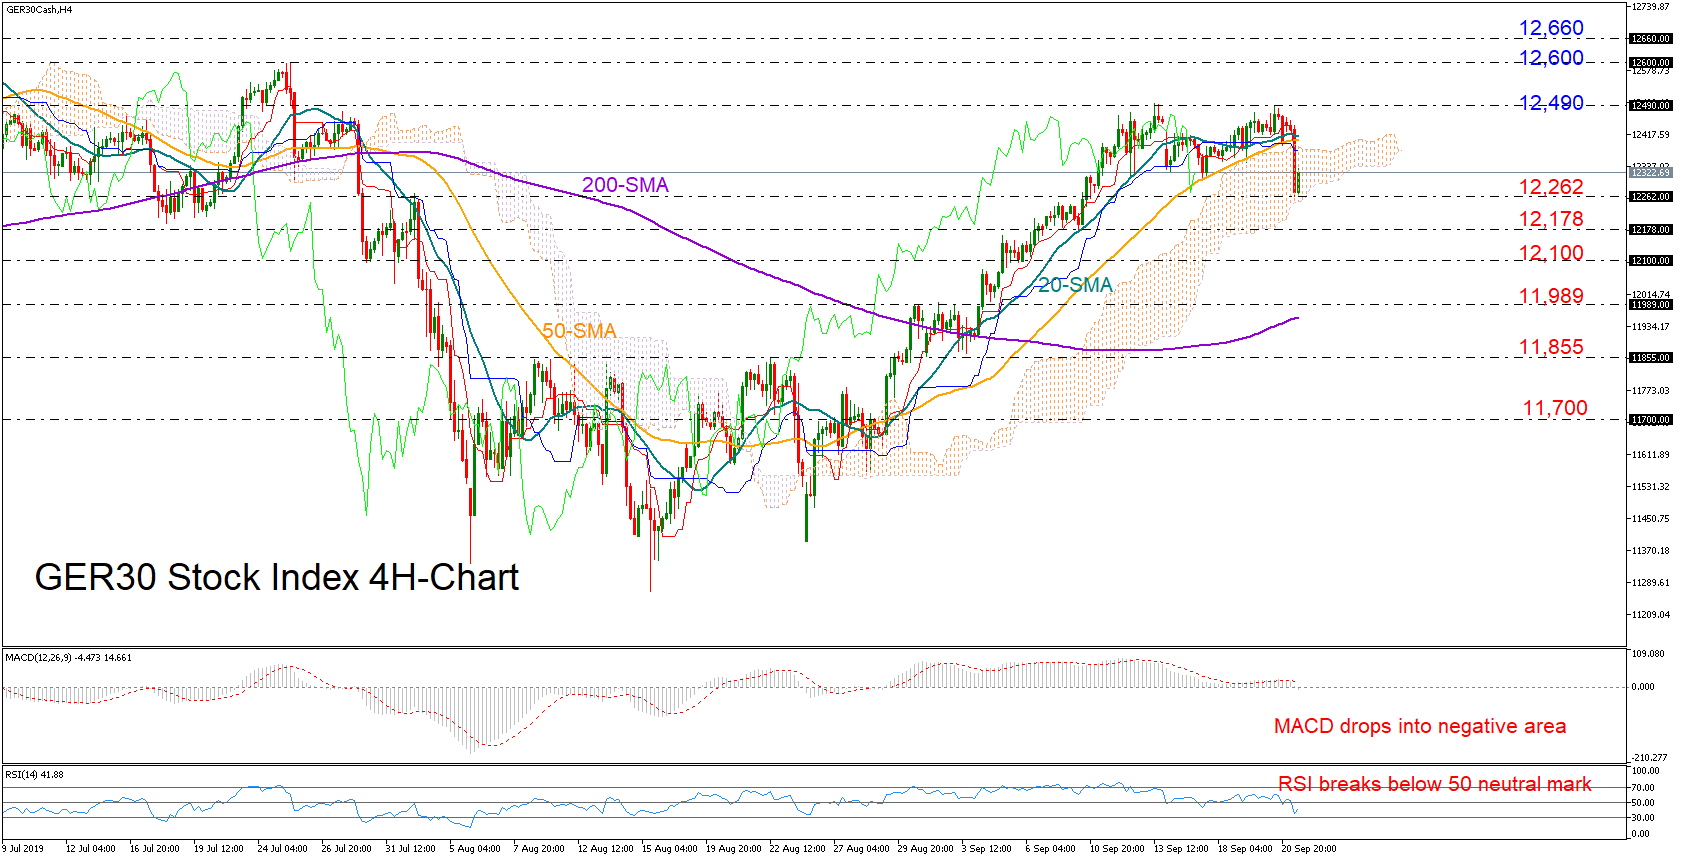
GER30 stock index corrected sharply to the downside and under the 12,300 support level in the face of worse-than-expected PMI readings out of Germany and the whole Eurozone on Monday. Traders are currently waiting to see whether the bears can next breach the bottom of the Ichimoku cloud in the four-hour chart as the short-term bias has switched from neutral to bearish according to the RSI and the MACD. Slipping below the cloud and the 12,262 number, the price may [..]

Technical Analysis – EURUSD maintains bearish bias; moves lower beneath trendline

Posted on September 23, 2019 at 8:53 am GMT

EURUSD bears moved the pair below the 1.1026 low of August 1 as well as the 1.1000 hurdle, which is the 23.6% Fibonacci retracement level of the down leg from 1.1411 to 1.0925. The price had deflected off the 1.1110 level where the 42-day simple moving average (SMA) merged with the downtrend line, rendering the double bottom pattern obsolete. While the SMAs imply a negative outlook, the momentum indicators concur, with the RSI declining below the neutral level, and the [..]

Technical Analysis – Gold retains ascending channel; looks neutral in short-term

Posted on September 23, 2019 at 7:17 am GMT

Gold managed to close slightly positive and above the 1,500 mark last week thanks to Friday’s rebound which found support around the bottom of the 4 ½-month old ascending channel. In the short-term, the precious metal could follow a sideways path as long as the RSI holds around its 50 neutral mark and the MACD fluctuates near its red signal line. Besides the lower boundary of the channel, traders will be closely watching the 1,485 handle where the market seems [..]

post-image

Technical Analysis – GBPNZD’s nearly 2-month rally dries up ahead of May high

Posted on September 20, 2019 at 1:47 pm GMT

GBPNZD after a decisive push north on September 13, fell inches short of the May high of 2.0020, plotting a shooting star suggesting the bears have taken control. The pattern was followed by an engulfing candle, backed by the momentum indicators reflecting a possible top reversal. The Tenkan-sen and Kijun-sen lines have flattened, with the RSI in the overbought region, while the MACD currently deep in the positive area, has already turned down towards its red trigger line. Despite this, [..]

post-image

Technical Analysis – GBPAUD spikes to 4-month high; additional gains could be limited

Posted on September 20, 2019 at 9:47 am GMT

GBPAUD stretched Thursday’s impressive rally to a four-month high of 1.8492 on Friday and is ready to close the week up by 1.7%. The RSI has also picked up steam and is currently pointing towards its 70 overbought mark, while the Stochastics have yet to confirm overbought conditions, suggesting that the bullish momentum is likely to stay in a limited time frame. On the way up, the bulls could take a break near the 1.8600 round-level – a congested area during the [..]

Technical Analysis – EURNZD possibly forming triple top near 10-month high

Posted on September 20, 2019 at 9:40 am GMT

EURNZD is again attempting to overcome the 1.7590 resistance region tested multiple times over August. The bulls recent rally from 1.7000 is backed by the Tenkan-sen that has already distanced itself from the Kijun-sen, as well as the momentum oscillators reflecting a persisting positive picture. Furthermore, the 21-period simple moving average (SMA) has completed a bullish cross of the 100- and 200-period SMAs. That said, the 100-period SMA has approached the 200-period SMA, and looks to complete a bearish cross, thus traders need to be aware of a possible [..]

Technical Analysis – USDCAD bulls relax under 200-day SMA

Posted on September 20, 2019 at 7:24 am GMT

USDCAD bulls relaxed near the 200-day simple moving average (SMA) on Thursday, letting the price slip back into the 1.3200 handle. According to the RSI and the MACD, traders could behave neutral in the short-term as the former hovers around the 50 mark and the latter is showing little strength around its red signal line. Although the pair managed to inch above the 50% Fibonacci of the downleg from 1.3563 to 1.3015 this week, it could not close above it, [..]

post-image

Technical Analysis – NZDUSD still bearish, but forming possible double bottom 

Posted on September 20, 2019 at 7:19 am GMT

NZDUSD bears are at the wheel and have steered the pair back on track with the medium-term negative picture. The price recovered on September 3, to hit a pothole at the 200-period simple moving average (SMA) on the four-hour chart, before the sellers reversed the price back down from the obstructing resistance of 0.6445. The 50-period SMA has turned back down to merge with the 100- and 200-period SMAs enduring negative outlook. The Tenkan-sen has completed a bearish cross and [..]

Risk Warning: Your capital is at risk. Leveraged products may not be suitable for everyone. Please consider our Risk Disclosure.