XM does not provide services to residents of the United States of America.

Technical Analysis

post-image

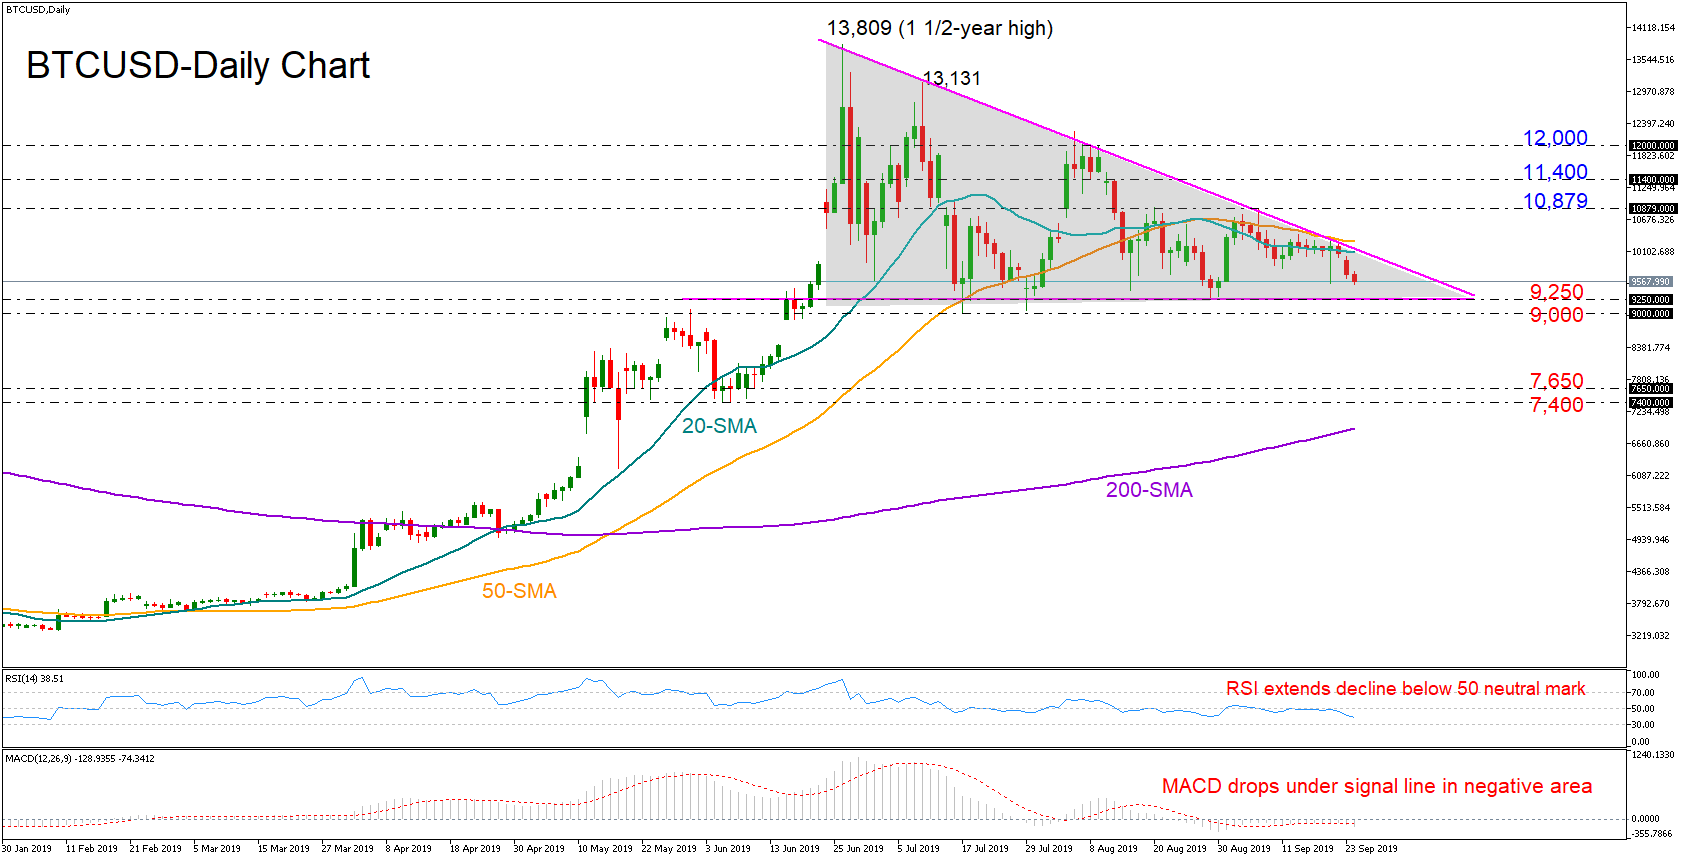
Technical Analysis – AUDJPY rebounds from 10-year low, but downtrend still in play

Posted on September 25, 2019 at 1:24 pm GMT

AUDJPY fell to 69.95 in late August, a level not seen since 2009, but found fresh buy orders and managed to rebound. The price then touched 74.50, and retreated again, keeping the pattern of lower lows and lower highs on the daily chart intact and hence confirming that the longer-term downtrend is still in force. In the short-term though, the pair seems stuck in a sideways range between 74.50 and 69.95. Momentum oscillators mostly concur with the relative flat near-term [..]

Technical Analysis – AUDUSD decline restricted around 23.6% Fibonacci

Posted on September 25, 2019 at 9:46 am GMT

AUDUSD has plotted a bullish harami cross pattern around 0.6770, which is the 23.6% Fibonacci retracement of the down leg from 0.7081 to 0.6676. The pattern suggests that the recent plunge from September 18 that has steered out of the Ichimoku cloud may be coming to an end, backed, also by the bullish cross. The 40-, 100- and 200-day simple moving averages (SMAs) endorse the negative picture, while the MACD is underneath its red trigger line and has slipped marginally [..]

Technical Analysis – NZDUSD may keep some positive traction in short-term

Posted on September 25, 2019 at 7:34 am GMT

NZDUSD spiked above the 50-period simple moving average (SMA) in the four-hour chart following the rate announcement by the Reserve Bank of New Zealand early on Wednesday, but the bottom of the Ichimoku cloud proved tough to pierce, with the price pulling back. Technically, there might be some bullish momentum in store as the MACD tries to make its way up in the positive region and higher than its signal line, while the red Tenkan-sen continues to point upwards above the blue [..]

post-image

Technical Analysis – CADJPY bulls flirt with 100-SMA after correction

Posted on September 24, 2019 at 3:33 pm GMT

CADJPY bulls are pushing against the 100-day simple moving average (SMA), after a pullback rendered the end of the rally that commenced on August 26. The short-term reversal before the 82.10 level, which is the 76.4% Fibonacci retracement of the down leg from 83.22 to 78.48, was halted as its decline found support at the 50-day SMA. The price seems to have started to consolidate, as the SMAs are converging and the price has found itself trapped between the 80.56 [..]

post-image

Technical Analysis – BTCUSD descending triangle breakout could be nearing

Posted on September 24, 2019 at 2:48 pm GMT

BTCUSD (Bitcoin) has been gradually making lower highs since June’s spike to the 1½-year high of 13,809, what now looks to be a descending triangle with a support line around 9,250. The technical indicators are currently favoring a bearish picture for the short-term, as the RSI is maintaining a downward slope under its 50 neutral mark and the MACD seems to be gaining negative momentum below its red signal line. The base around 9,250 could reject downside corrections but if [..]

post-image

Technical Analysis – JP225 index bounces on 50% Fibonacci; bias has yet to shift positive

Posted on September 24, 2019 at 10:28 am GMT

Japan’s 225 stock index drifted higher after stepping on the 50% Fibonacci of the downleg from 24,472 to 19,239 and the upper surface of the Ichimoku cloud in the four-hour chart. While the positive momentum in the MACD and the location of the RSI, which managed to climb above its 50 neutral level, indicate some improvement in the sentiment, the bullish bias has yet to be confirmed as the former holds under its signal line and the latter seems to [..]

Technical Analysis – GBPUSD fails to conquer swing high; reverses back below 100-SMA

Posted on September 24, 2019 at 10:02 am GMT

GBPUSD bears took control, pivoting the pair around the swing peak of 1.2578 from July 12. The price correction has slipped underneath the 1.2500 hurdle and the 100-day simple moving average (SMA), the former being the 38.2% Fibonacci retracement of the down leg from 1.3381 to 1.1957. Momentum indicators are starting to fall in line with the bigger bearish picture. The MACD is declining towards its red trigger line in the positive zone and the RSI is horizontal near the [..]

post-image

Technical Analysis – Silver reverses up from 200-SMA; bears try to stop the gains

Posted on September 24, 2019 at 7:24 am GMT

Silver’s bears resurfaced around the 2017 high of 18.63 after a rally which bounced off the 200-period simple moving average (SMA). The move up began once the price of the metal gapped back above the 200-period SMA, following a brief close beneath it on September 13. The upward sloping 21- and 42-period SMAs indicate that the move up may stick around, with the 200-period SMA also backing the bigger positive outlook. That said, short-term oscillators paint a mixed picture, as [..]

Technical Analysis – EURGBP bearish bias remains in place after touching 4-month lows

Posted on September 24, 2019 at 7:23 am GMT

EURGBP collected more losses after closing below the 50% Fibonacci of the upleg from 0.8470 to 0.9323, with the price hitting a four-month low of 0.8745 on Friday. The pair has been putting effort to change direction this week within the lower part of the descending channel, but the technical indicators provide little hope for a meaningful rally as the RSI seems to be reversing towards its 30 oversold mark again, while the red Tenkan-sen is flattening well below the blue Kijun-sen line. Traders [..]

post-image

Technical Analysis – USDCHF uptrend stumbles at 200-day moving average

Posted on September 23, 2019 at 3:17 pm GMT

USDCHF has retreated from last week’s three-month top of 0.9983 after finding resistance at the 200-day moving average (MA), which has flatlined along the 50% Fibonacci retracement of the April-August downleg. Prices are currently being supported by the 20-day MA at 0.9890 but momentum indicators are pointing to further weakness in the near term. The stochastics are sloping steeply downwards, while the RSI is heading towards its 50 neutral level. If the bears remain in control, USDCHF is likely to [..]

Risk Warning: Your capital is at risk. Leveraged products may not be suitable for everyone. Please consider our Risk Disclosure.