XM does not provide services to residents of the United States of America.

Technical Analysis

Technical Analysis – USDCAD stuck between converging SMAs

Posted on January 19, 2024 at 9:26 am GMT

USDCAD extends its rebound to a fresh 1-month high But does not manage to close above the 50-day SMA Momentum indicators turn positive USDCAD had been staging a solid recovery from its December low of 1.3176, but the 50-day simple moving average (SMA) prevented further gains. Despite the rejection, the 200-day SMA has been acting as a strong floor, thus the price is currently hovering between the converging SMAs. Considering that the MACD has climbed to its positive zone for the first [..]

post-image

Technical Analysis – USDCHF edges sharply higher from 9-year low

Posted on January 19, 2024 at 8:01 am GMT

USDCHF meets significant resistance lines Price move tries to switch broader outlook to positive Technical signs are bullish USDCHF is creating an impressive bullish rally from the nine-year low of 0.8332, adding more than 4% from the end of December. Currently, the market is battling with the 50-day simple moving average (SMA), which coincides with the 38.2% Fibonacci retracement level of the down leg from 0.9240 to 0.8332 at 0.8680. Technically, the RSI indicator is looking strongly positive as it [..]

post-image

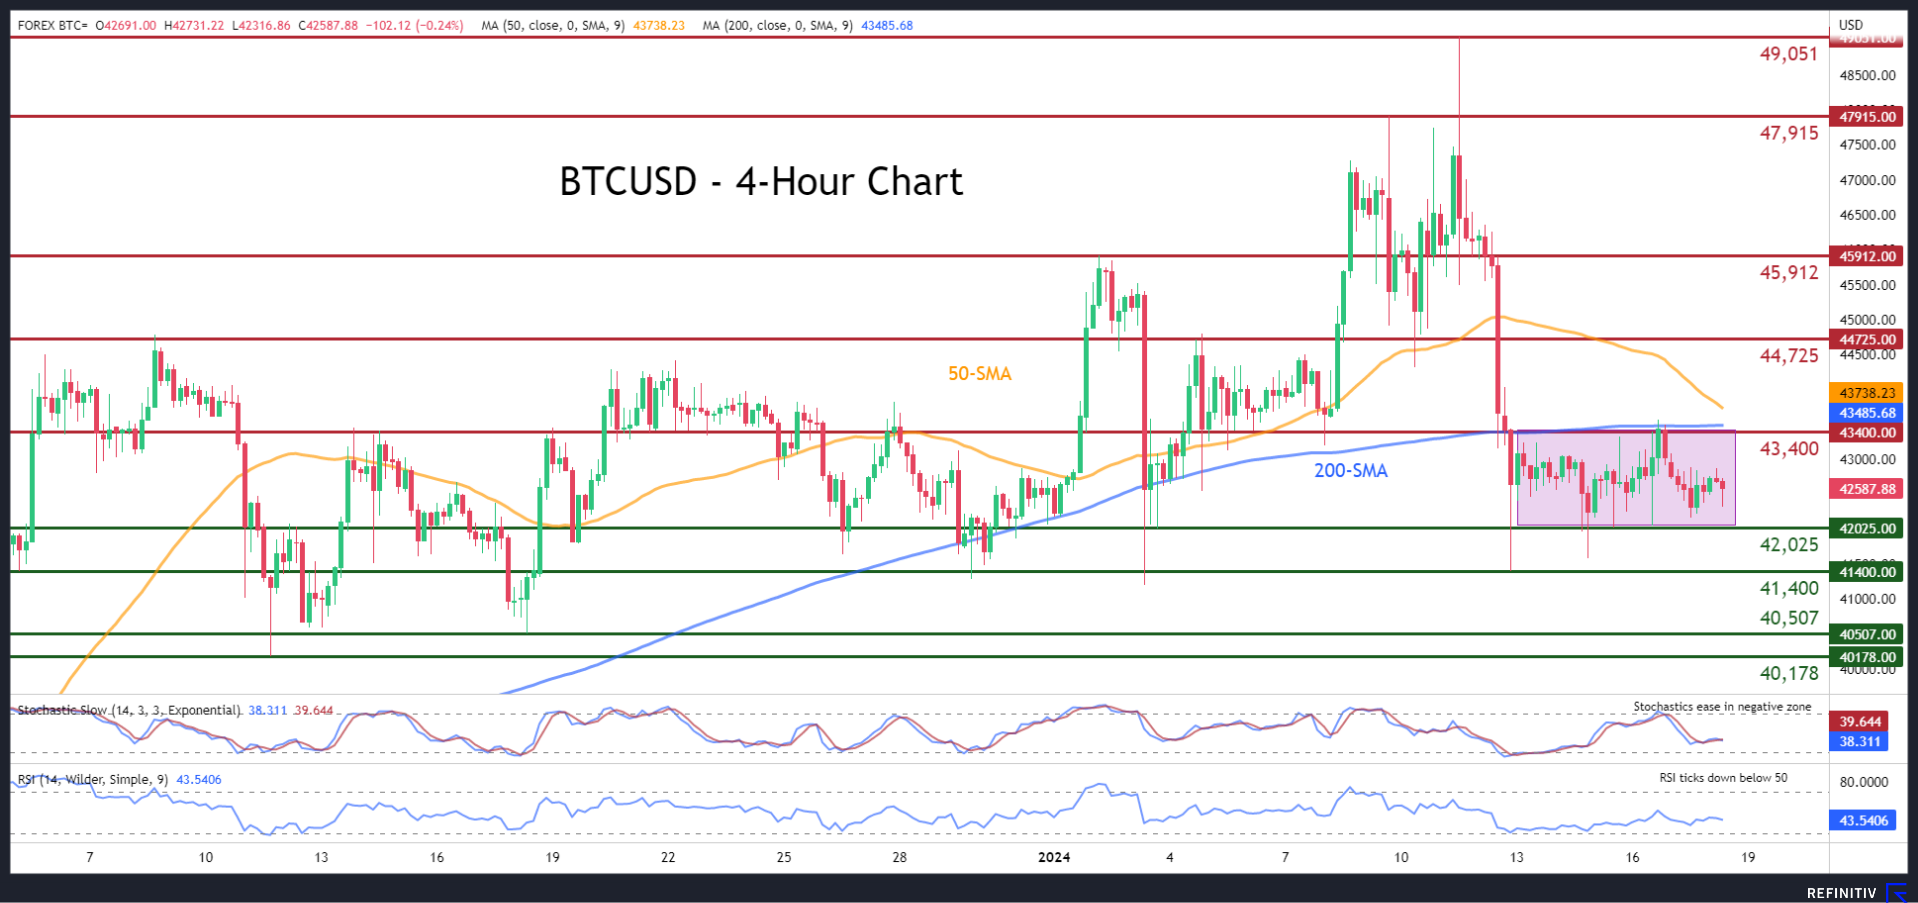
Technical Analysis – BTCUSD stuck in tight range

Posted on January 18, 2024 at 2:49 pm GMT

BTCUSD extends sideways move in narrow range The 200-period SMA rejects any upside attempts Momentum indicators deep in their negative zones BTCUSD (Bitcoin) has experienced a strong decline from its recent two-year peak of 49,051, dropping to as low as 41,400. Although the short-term oscillators have been tilted to the downside for the past few four-hour sessions, the digital coin managed to recoup some losses and adopt a neutral pattern. Should the bears attempt to push the price lower, immediate support could [..]

post-image

Technical Analysis – Could the US 100 cash index continue to range trade?

Posted on January 18, 2024 at 11:26 am GMT

US 100 index continues to trade a tad below its recent all-time high Its failure to record a higher high above 16,972 is raising eyebrows Momentum indicators in waiting mode, stochastic oscillator‘s next move is key The US 100 cash index is higher today, reacting to Wednesday’s strong red session. The index is currently battling with the November 22, 2021 high at 16,767, not far from its recently recorded all-time high of 16,972 and a tad above the long-term January 6, [..]

post-image

Technical Analysis – US dollar index battles with SMAs near 103.00

Posted on January 18, 2024 at 10:05 am GMT

US dollar index fails to extend upside move from 100.27 200-day SMA acts as important resistance RSI weakens above 50 The US dollar index is currently struggling to surpass the significant 200-day simple moving average (SMA), which stands near the 103.20 barrier. The market is moving back and forth of the 50- and the 200-day SMAs after the rebound off the 100.27 support level. The RSI is above its 50 neutral mark, although weaker, and the MACD is keeping its [..]

post-image

Technical Analysis – EURAUD extends rebound but meets barrier at trendline

Posted on January 18, 2024 at 9:46 am GMT

EURAUD punches through Ichimoku cloud to reach 2-month high Bullish bias remains strong but in danger of reversing EURAUD has been recovering sharply since the start of the year after tumbling to a seven-month low of 1.6127. The rebound gathered further strength this week as the price pierced above the Ichimoku cloud and briefly peaked at a two-month top of 1.6671 on Thursday. But momentum started to wane after running into the upper trendline of the descending channel. This shouldn’t [..]

Technical Analysis – EURUSD finds support at the 200-day SMA

Posted on January 18, 2024 at 9:19 am GMT

EURUSD had been rangebound before sliding lower But the retreat ceases at the 200-day SMA Momentum indicators remain tilted to the downside EURUSD had been trading sideways since the beginning of the year following its pullback from the December high of 1.1138. The pair spiked lower on Tuesday, but the congested region that includes the 200-day simple moving average (SMA) and the top of the Ichimoku cloud rejected further retreats. Considering that both the RSI and stochastics are deep in their [..]

Technical Analysis – WTI oil futures swing within neutral triangle

Posted on January 18, 2024 at 8:48 am GMT

WTI oil futures extend horizontal move Resistance at 73.85; support at 69.60    WTI oil futures (February delivery) have been in a range so far in January, printing a neutral triangle pattern at the bottom of the broad bearish channel. Given the RSI’s continuous efforts to climb above its 50 neutral mark and the improvement in the MACD, there is a ray of hope for a bullish breakout. Practically though, the price will have to overcome a few obstacles before the [..]

post-image

Technical Analysis – AUDUSD edges higher after 2-month low

Posted on January 18, 2024 at 8:34 am GMT

AUDUSD remains beneath uptrend line and 200-day SMA Bearish wave on the cards RSI and stochastic suggest upside recovery AUDUSD is recouping some losses today after the aggressive sell-off of the preceding three days, posting a new two-month low near 0.6520. The pair slipped beneath the medium-term ascending trend line and the 200-day simple moving average (SMA), shifting the outlook to bearish. However, the technical oscillators are showing some signs of recovery. The RSI is ticking upwards in the bearish [..]

post-image

Technical Analysis – EURCHF recovers somewhat from all-time low

Posted on January 17, 2024 at 10:11 am GMT

EURCHF rises above 20-day SMA RSI and MACD are strengthening EURCHF is rising after the bounce off the record low of 0.9253 at the end of 2023. The pair surpassed the 20-day simple moving average (SMA) with the scope to test the immediate inside swing low of 0.9395. According to technical oscillators, the RSI is moving higher and is ready to cross above the 50 level, while the MACD is extending its positive structure above its trigger line in the [..]

Risk Warning: Your capital is at risk. Leveraged products may not be suitable for everyone. Please consider our Risk Disclosure.