XM does not provide services to residents of the United States of America.

Technical Analysis

post-image

Technical Analysis – EURGBP short-term bias weaker, nearby resistance keeps pressuring

Posted on November 5, 2019 at 9:57 am GMT

EURGBP is trading in a tight narrow range of 0.8574-0.8676 which is part of the three-month-old bear trend. The soft upward move in the RSI and the MACD reflects a weaker short-term bearish bias but a closing price above the 0.8676 resistance could attract some buying interest towards 0.8753, which is the 23.6% Fibonacci retracement of the downleg from 0.9324 to 0.8574. Slightly higher, a breach of the 0.8800-0.8860 noisy area, where the 38.2% Fibonacci and the longer-term SMAs are [..]

Technical Analysis – GBPUSD’s positive signals remain intact despite consolidating

Posted on November 5, 2019 at 9:27 am GMT

GBPUSD looks to have lost some steam transitioning into a sideways move, with the short-term oscillators reflecting a stall in momentum. The pair may be in the process of forming a pennant – valid on a break of the upper or lower lines – after the rally from October 8, which pushed the price aggressively above all the simple moving averages (SMAs). The MACD, deep in the positive region, has moved slightly below its red trigger line, while the stochastics [..]

Technical Analysis – AUDUSD extends recovery, supported by Bollinger bands

Posted on November 5, 2019 at 8:18 am GMT

AUDUSD has been printing higher highs and higher lows since the beginning of October, with any pullbacks being capped by the lower Bollinger band on the 4-hour chart. The near-term outlook therefore seems to have shifted to positive, though a break above 0.6930 may be needed to cement that. Short-term momentum oscillators concur with the bullish bias, as the RSI climbed above 50 and is pointing higher, while the MACD seems ready to challenge its red trigger line at any [..]

post-image

Technical Analysis – USDSEK capped by 100-day SMA and 50.0% Fibonacci; possible formation of a head and shoulders pattern

Posted on November 4, 2019 at 4:24 pm GMT

USDSEK buyers are attempting to push above 9.6020, which is the 50.0% Fibonacci retracement of the up leg from 9.2390 to 9.9630, and where the 100-day simple moving average (SMA) resides. The bulls’ efforts to halt further losses could be in vain, as a head and shoulders pattern appears to near completion, with a close below 9.5540 and the neckline potentially signaling a deeper downtrend. The short-term oscillators reflect mixed signals but lean towards the negative picture. The MACD is [..]

post-image

Technical Analysis – GER30 index bullish bias back on track

Posted on November 4, 2019 at 1:36 pm GMT

GER30 stock index bulls pushed above the 12,985 previous high from October 28, realigning the index with the short-term positive picture. Further backing the positive momentum is the fresh bullish crossover of the upward sloping Tenkan-sen and Kijun-sen lines and the price distancing itself above the Ichimoku cloud. The MACD, still in the positive zone, is increasing above its red trigger line, supporting the positive view. The upward sloping RSI has ascended into the overbought territory, also supporting further advances. [..]

Technical Analysis – EURUSD cautiously bullish; capped by 200-day SMA

Posted on November 4, 2019 at 10:15 am GMT

EURUSD sellers are in the process of halting buyers’ efforts to push above 1.1179 – which is the fresh swing high of October 21, following a three-week ascent – to retest the 200-day SMA. The short-term has shifted into what looks like a neutral market, something also backed by the flat Tenkan-sen and Kijun-sen lines. However, the positive momentum in the technical indicators is still intact but slightly reduced. The RSI, currently in bullish territory, is sloping slightly downwards. The [..]

post-image

Technical Analysis – Gold approaches the upper boundary of a range

Posted on November 4, 2019 at 8:22 am GMT

Gold has remained confined in a narrow sideways range – with an upper bound near 1517 and a lower end around 1474 – for a month now. The short-term bias is therefore neutral, something also supported by the converging 50- and 200-period simple moving averages (SMAs) on the 4-hour chart. A clear break on either side of this range is required to set the near-term direction. Taking a look at momentum oscillators though, they paint a slightly bullish picture, suggesting [..]

post-image

Technical Analysis – USDNOK’s positive picture watchful; sellers drive price below uptrend line

Posted on November 1, 2019 at 3:09 pm GMT

USDNOK sellers are in the process of penetrating below the 8.1055 support – which is the 23.6% Fibonacci retracement of the up leg from 8.4664 to 9.3036 – after already violating the uptrend line drawn from July 18. The short-term oscillators continue to reflect strengthening negative momentum as the price nears the 50-day simple moving average (SMA). The MACD, in the positive region, has declined below its red trigger line, while the RSI has crossed below its neutral mark into [..]

post-image

Technical Analysis – AUDCAD slightly eases after rallying above 100-day SMA and Ichimoku cloud

Posted on November 1, 2019 at 1:36 pm GMT

AUDCAD buyers are again in the process of pushing higher, after fiercely overcoming the 20-, 50- and 100-day simple moving averages (SMA) and climbing above the Ichimoku cloud. The pair bounced off a floor – in formation since August – around 0.8900 on October 25. The short-term oscillators lean towards positive momentum improving. The MACD is in the positive zone, distancing itself above its red trigger line, while the RSI has turned slightly up again in bullish territory. Moreover, supporting [..]

post-image

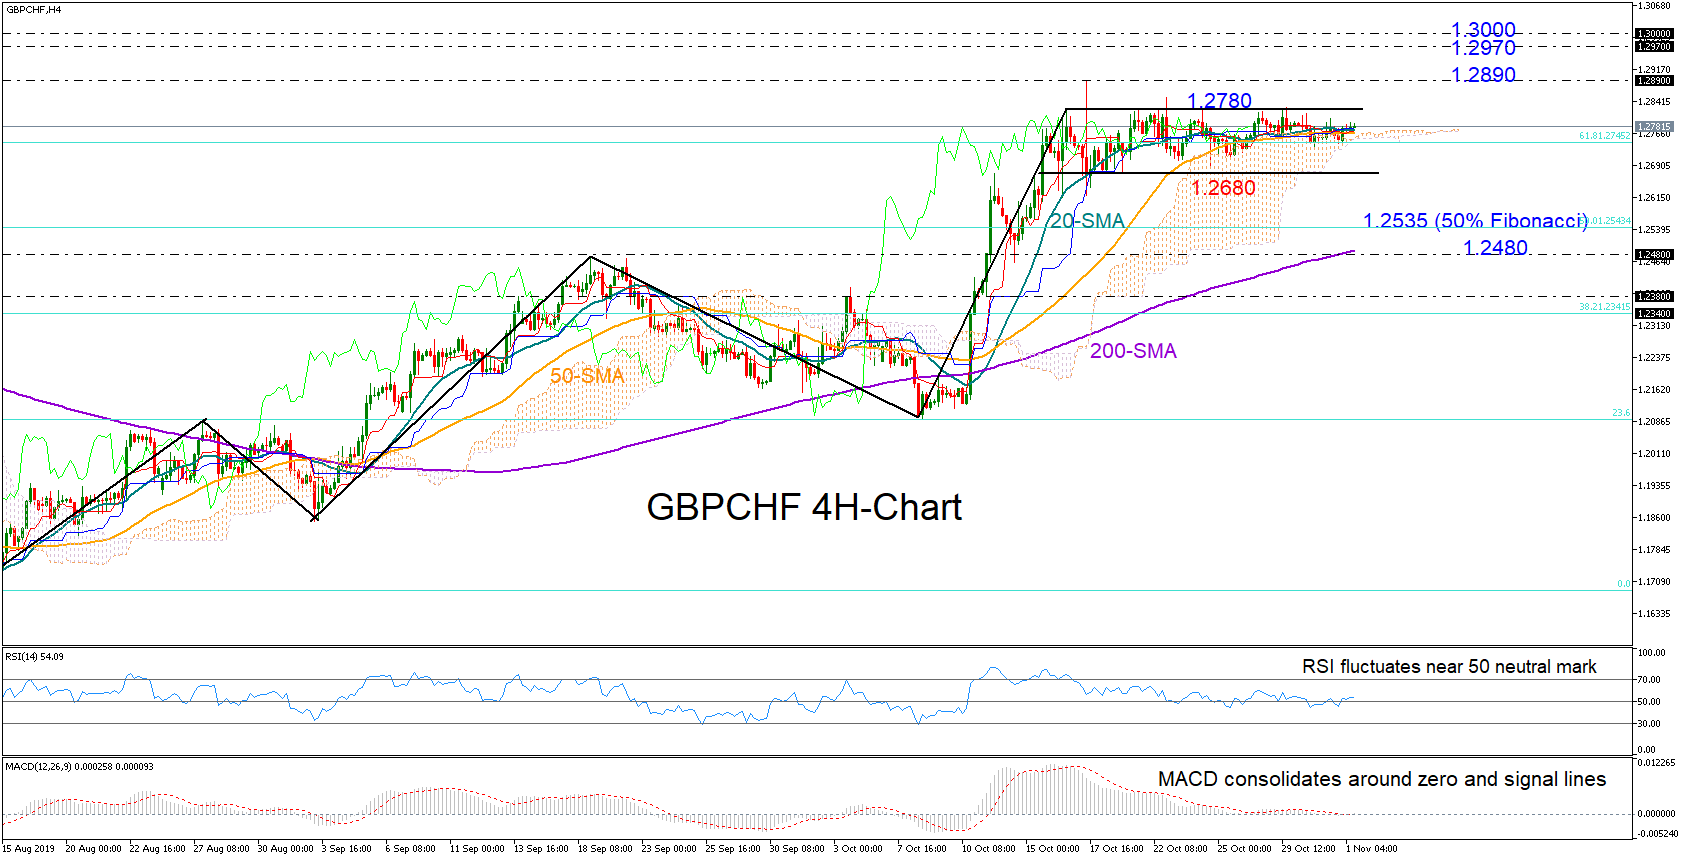
Technical Analysis – GBPCHF forms a bullish rectangle; short-term bias neutral

Posted on November 1, 2019 at 10:49 am GMT

GBPCHF has formed a rectangle in the four-hour chart that is part of a broader upward pattern started from an 8-year low of 1.1670 in August. The flattening RSI and the muted MACD provide no clue that the consolidation phase may end in the near term. Nevertheless, buyers would be eagerly waiting for a decisive close above 1.2820 and the resistance line, in which case additional gains could follow, with the price stalling initially near 1.2890 and then within the 1.2970-1.3000 zone. [..]

Risk Warning: Your capital is at risk. Leveraged products may not be suitable for everyone. Please consider our Risk Disclosure.