XM does not provide services to residents of the United States of America.

Technical Analysis

post-image

Technical Analysis – GBPUSD bears may keep ruling in short-term

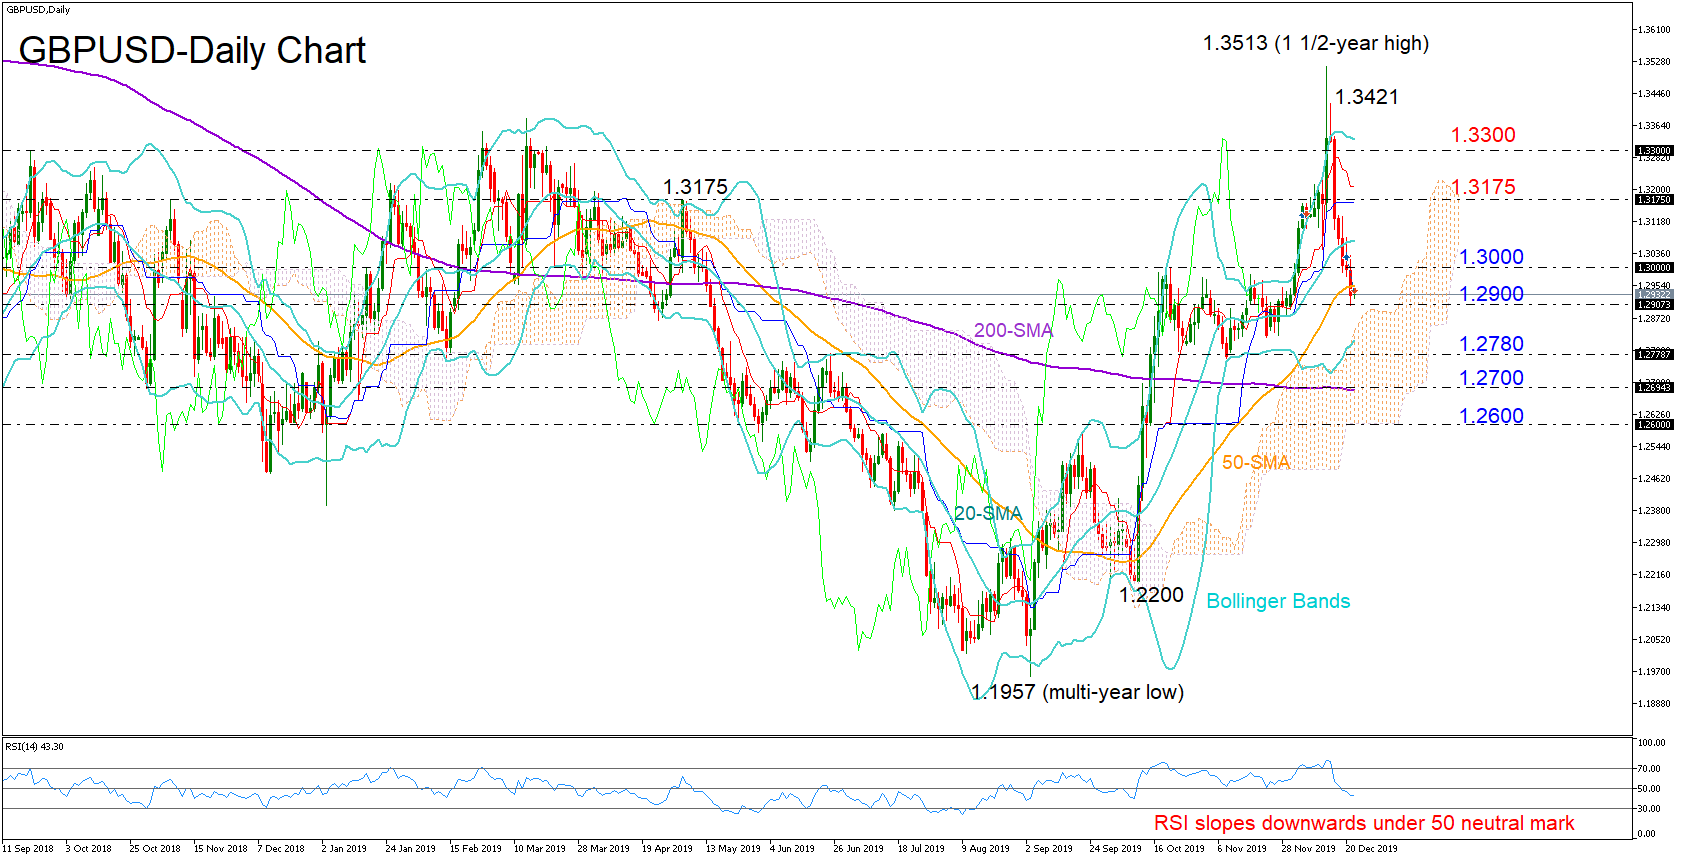
Posted on December 24, 2019 at 8:19 am GMT

GBPUSD plummeted back to the 1.2900 territory and below its 20- and 50-day simple moving averages (SMAs), erasing all the election gains that drove the pair to a 1 ½ -year high of 1.3513. The short-term outlook keeps looking cloudy as the price has crossed below the middle Bollinger band but has yet to touch the lower band, while the RSI is also making its way down below its 50 neutral mark. Should the sell-off strengthen beneath the 1.2900 level that acted as support on Monday, the [..]

post-image

Technical Analysis – GBPCHF enters bearish area; maintains uptrend in medium-term

Posted on December 23, 2019 at 3:38 pm GMT

GBPCHF lost significant ground and dived below its 20- and 50-day simple moving averages (SMAs) after unsuccessfully attempting to grow into the 1.3300 region. The market is currently trading in bearish waters according to the RSI, which is strengthening to the downside and below 50, while the slowing MACD that deviates under its red signal line endorses the negative correction as well. The 38.2% Fibonacci of 1.2682 of the 1.2670-1.3307 bullish wave is keeping the bears under control at the moment. If it [..]

post-image

Technical Analysis – USDJPY constrained around 61.8% Fibonacci, lacks momentum

Posted on December 23, 2019 at 3:04 pm GMT

USDJPY has been hovering around the 61.8% Fibonacci retracement level of 109.36 of the downleg from 112.39 to 104.44 for the past 10 days, with the 109.70 barrier holding back efforts to break above this key resistance point. Momentum indicators suggest a near-term breakthrough for the bulls won’t be possible as the stochastics are trending downwards, and the RSI has flatlined. However, both remain above the 50 neutral level so positive forces still have the upper hand. If the pair [..]

post-image

Technical Analysis – USDMXN looks for a rebound as oversold conditions detected

Posted on December 23, 2019 at 10:36 am GMT

USDMXN paused its 3-week old decline near the key 18.80 support area last week. Meanwhile the RSI has touched its 30 oversold mark and is now looking for a rebound, whilst the fast-Stochastics have already reversed after posting a bullish cross below 20, both increasing the odds for a rebound in the price or at least ruling out the event of a steeper sell-off. The negative momentum in the MACD also seems to have slowed down, adding to the above encouraging signals. A forceful [..]

post-image

Technical Analysis – Gold finally climbs above resistance trendline; eyes turn to 1,490

Posted on December 23, 2019 at 9:12 am GMT

Gold is reviving bullish momentum after an almost flat week, with the precious metal finally looking for a closure above the four-month old restrictive descending trendline that is part of a downward sloping channel before the Christmas and New Year’s festivities begin. The RSI and the MACD are endorsing the positive move in the price (also in the 4-hour chart) as the former is resuming its upside direction above its 50 neutral mark and the latter is trying to expand [..]

post-image

Technical Analysis – EURUSD upside stalls at 1.1178; short-term bias neutral-to-bearish

Posted on December 23, 2019 at 7:58 am GMT

EURUSD could not reactivate it’s two-month old upside direction that stuck around the 1.1178 area as the 200-day simple moving average (SMA) proved hard to overcome last week. Even though the price spiked above the line, registering a fresh high at 1.1198, the bears retook control, driving the market back into the 1.100 territory. Currently, the pair is pushing efforts to rebound near the 1.1072 key barrier and its 20- and 50-day SMAs but the RSI and the MACD have [..]

post-image

Technical Analysis – GBPCAD cautiously positive as decline hits a wall at the 50-day SMA

Posted on December 20, 2019 at 2:04 pm GMT

GBPCAD’s aggressive reversal marginally ahead of the previous high from March 12 of 1.7793 has come to a standstill at the 1.7058 level – which is the 38.2% Fibonacci retracement of the up leg from 1.5874 to 1.7790 – that previously restricted further advances in the pair. The short-term oscillators reflect conflicting signals in directional momentum. The MACD has dropped far below its red trigger line but remains in the positive zone, while the RSI has dipped below its neutral [..]

post-image

Technical Analysis – Tesla stock flies to fresh all-time highs; bullish and overbought

Posted on December 20, 2019 at 11:31 am GMT

Tesla’s stock price skyrocketed past 400.00 to uncharted territory and above the 386.83 ceiling that kept the bulls under control in the 2017-2018 period, sending the fast-RSI well into the overbought territory. The latter increases the odds for a downside correction, though only a decisive close below the previous high of 360.66 would raise concerns about the sustainability of the market’s upward direction. In order to get to 360.66, sellers should breach the December 2018 peak of 380.00. If more [..]

post-image

Technical Analysis – USDCHF breaks lower as bears take the wheel

Posted on December 20, 2019 at 11:07 am GMT

USDCHF broke below an uptrend line in early December, which later acted as resistance, forcing the market to head down and post a lower low on the daily chart. The near-term bias has therefore turned negative, something also endorsed by the downward slope in the 50-day simple moving average (SMA). Negative momentum has taken a breather though, as indicated by the rebound off the 0.9770 zone and the latest upturn in the RSI. That said, the RSI is still well [..]

Technical Analysis – USDCAD preserves a bearish tone, trapped in a range

Posted on December 20, 2019 at 9:42 am GMT

USDCAD seems to be on track to reach a significant support structure, despite its overall neutral picture reflected in the flat 200- and 100-day simple moving averages (SMAs), which are not giving any obvious direction. The short-term oscillators reflect the stall in negative directional momentum. The MACD in the negative region has flattened below its red trigger line, while the RSI is rising in bearish territory. However, the ADX continues to indicate that a strong negative trend is in place. [..]

Risk Warning: Your capital is at risk. Leveraged products may not be suitable for everyone. Please consider our Risk Disclosure.