XM does not provide services to residents of the United States of America.

Technical Analysis

Technical Analysis – GBPJPY may realign with positive picture despite consolidation

Posted on January 10, 2020 at 9:03 am GMT

GBPJPY appears to have stalled below the flat lines of the Bollinger bands, but buyers are attempting to overtake the mid-band at 143.08, after the bounce off the lower-band. The fresh positive push seems to also be aided by the bullish crossover of the 200-day simple moving average (SMA) by the 100-day one. The short-term oscillators reflect the stall in the market but lean towards a positive view. The MACD, is slightly above the zero level but only just below [..]

post-image

Technical Analysis – USDCNH extends downtrend to 5-month low; searches for a rebound

Posted on January 10, 2020 at 8:46 am GMT

USDCNH has been developing in a downtrend since the peak at an all-time high of 7.193 in early-September, with the price retreating below the 200-day exponential moving average (EMA) to touch a five-month low at 6.9156 on Thursday. The sell-off is looking overstretched according to the RSI which seems to be rebounding near its 30 oversold mark and the fact that the 50% Fibonacci of the 6.6686-7.193 upleg is in the neighborhood, further increases the case for an upside correction in the price. Yet [..]

Technical Analysis – USDCAD climbs higher but is capped by 20-SMA

Posted on January 10, 2020 at 7:18 am GMT

USDCAD recorded its third day of gains after a failed attempt to break significantly below the 21-month low of 1.2950 on Tuesday. In the longer-term timeframe, the pair is still moving in a bearish direction. Chances for a short-term reversal are increasing as the stochastic oscillator is approaching its overbought territory. Moreover, the MACD posted a bullish crossover with its trigger line in the bearish area, suggesting a possible upside correction. However, the pair hit the 20-period simple moving average [..]

post-image

Technical Analysis – EURTRY loses ground with the retracement nearing the 50.0% Fibonacci

Posted on January 9, 2020 at 4:04 pm GMT

EURTRY’s recent correction stretched below 6.538, which is the 38.2% Fibonacci retracement of the up leg from 6.287 to 6.694 and is now testing the swing low of 6.509. The aggressive dive seems to be eyeing the 50.0% Fibo of 6.490 and looks to be aided by the bearish crossover of the 50-period simple moving average (SMA) by the 20-period one on the four-hour chart. The short-term oscillators suggest negative momentum may pick up, indicating that the decline could extend [..]

post-image

Technical Analysis – Tesla’s crazy rally nears a make or break point

Posted on January 9, 2020 at 2:38 pm GMT

Tesla’s stock price skyrocketed to a fresh record high of 498.07 on Wednesday, increasing its weekly gains to 15% due to strong vehicle delivery numbers. The RSI, although well into the overbought territory, has yet to show signs of weakness, keeping the short-term bias strongly positive. Yet, with the indicator approaching a former resistance area, some caution should be taken unless the price clears the 500.00 level, shifting the spotlight next to the 520.00 and 540.00 psychological marks. Should the bears retake [..]

post-image

Technical Analysis – Palladium futures sellers surface putting pressure on the ascent

Posted on January 9, 2020 at 1:41 pm GMT

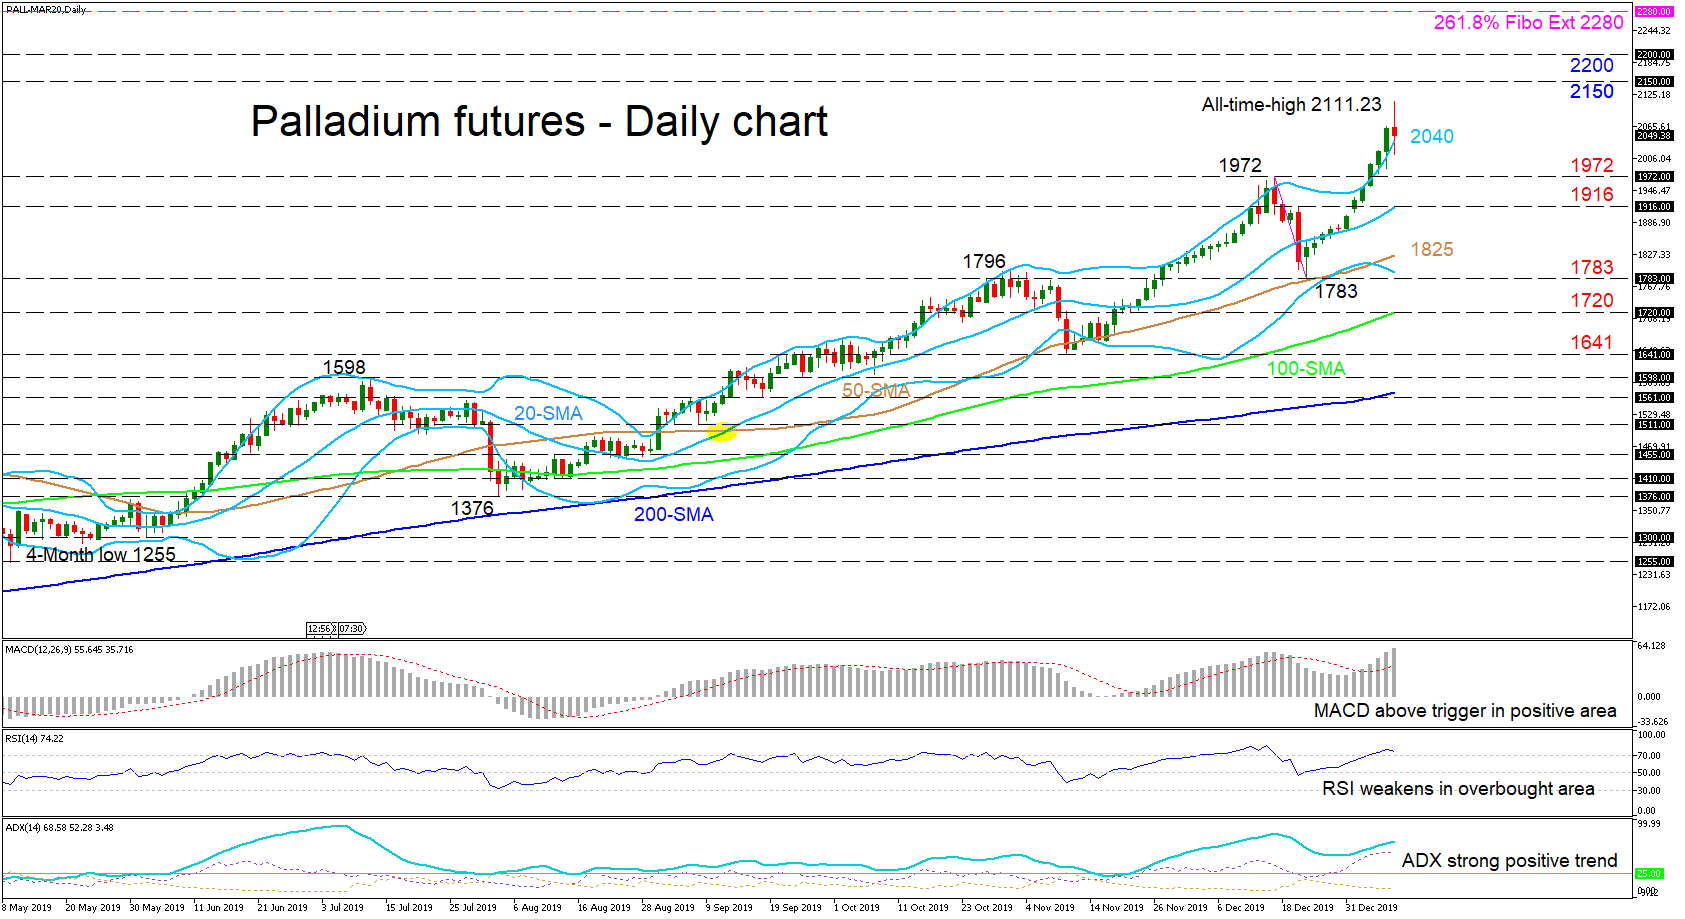
Palladium futures sellers have emerged after the recent rally, which bounced off the 50-day simple moving average (SMA) at 1783 and stretched the commodity above the upper-Bollinger band plotting a fresh all-time-high of 2111.23. The upward sloping SMAs continue to paint an improving positive picture as do the technical indicators. That said, the slight decline in the RSI – in the overbought territory – suggests a slight weakening in the existing bullish view cautioning for a pullback towards the mid-level [..]

post-image

Technical Analysis – Brent futures reverse quickly lower after touching 8-month peak

Posted on January 9, 2020 at 1:37 pm GMT

Brent futures extended their Wednesday losses and are currently trading far below the eight-month high of 71.30, slipping beneath the 20-day simple moving averages (SMAs) and the blue Kijun-sen line.  However, in the medium-term the price has a bullish view confirmed by higher highs and higher lows. The RSI turned lower after entering the bearish area. At the moment, it continues to head lower in support of a negative short-term picture. The bias in the very-short-term also looks bearish as [..]

post-image

Technical Analysis – US 100 rallies to fresh record highs again

Posted on January 9, 2020 at 12:05 pm GMT

The US 100 index has been in a flying mode since yesterday, recording again a fresh all-time high around 8974.27 after it hit the 8660 support, which overlaps with the short-term 20-day simple moving average (SMA). According to the RSI, the market could maintain positive momentum in the short-term as the indicator is positively sloped above its 70 level, though the fast Stochastics suggest that the market is located in overbought territory and therefore some weakness is possible; the blue [..]

post-image

Technical Analysis – GER 30 index reactivates long-term uptrend; eyes record high

Posted on January 9, 2020 at 10:59 am GMT

The German 30 stock index opened positive this week after hitting support at 12,946, which is where the price bottomed in December and peaked in October. The bulls are currently pushing efforts to extend the uptrend off 10,276 towards the record high of 13,600 registered on January 2018 and while the upward slope in the RSI endorses the positive move, the MACD has yet to comfortably rise above its red signal line, suggesting that some caution remains in the market. A [..]

Technical Analysis – NZDUSD’s decline off 2019 high turns sideways at 23.6% Fibonacci

Posted on January 9, 2020 at 9:10 am GMT

NZDUSD looks to have turned flat, confined between 0.6680 and 0.6616 over the last week, following the decline from the five-month high of 0.6754 for the end of 2019. The pair has found support within this range from the 0.6634 area, which is the 23.6% Fibonacci retracement of the up leg from 0.6239 to 0.6754 and where the 100-period simple moving average (SMA) currently is located. That said, the short-term oscillators suggest that negative momentum may be picking up. The [..]

Risk Warning: Your capital is at risk. Leveraged products may not be suitable for everyone. Please consider our Risk Disclosure.