XM does not provide services to residents of the United States of America.

Technical Analysis

post-image

Technical Analysis – US 500 index prints bearish doji after new record high of 3,295

Posted on January 15, 2020 at 1:49 pm GMT

The US 500 stock index (cash) seems to be completing a bearish doji star formation if it ends the day in the red. The price recorded a fresh all-time high of 3,295 on Tuesday but the overbought conditions have already been detected as the RSI has been flattening near the 70 level over the last month. The slowdown in the MACD further increases the case for a downside correction or at least for some stabilization. Traders would like to see [..]

post-image

Technical Analysis – EURCHF tumbles towards 33-month low; negative outlook at play

Posted on January 15, 2020 at 10:16 am GMT

EURCHF is holding to losses for the third week in a row, dropping to a 33-month low of 1.0758 earlier today. The sharp sell-off has driven the pair beneath the six-month trading range of 1.0810 – 1.1055, turning the outlook from neutral-to-bearish. In the very short-term, the market could maintain a downward move if the RSI keeps moving in the oversold zone and the MACD extends its momentum below the trigger line. Regarding the trend, the 20-day simple moving average (SMA) continues to lose [..]

Technical Analysis – AUDUSD retreats below short symmetrical triangle

Posted on January 15, 2020 at 8:34 am GMT

AUDUSD is slipping below a short symmetrical triangle formed between the 20- and the 50-period simple moving averages (SMAs) in the four-hour chart. However, the fact that the 20-period SMA is preparing to cross above the 50-period SMA is still sending some possible trend signals if completed. In momentum indicators, signals remain neutral to bearish as the RSI is pointing downwards below 50, while the MACD keeps flattening around its red signal line. Should sellers dominate below the 0.6880 restrictive [..]

Technical Analysis – EURJPY hovers below 6-month peak; holds in ascending channel

Posted on January 15, 2020 at 7:32 am GMT

EURJPY has been trading within an upward sloping channel after the rebound on the 28-month low of 115.85, reached on September 2019. Currently, the price is trading close to yesterday’s six-month high of 122.75, having pulled back slightly. The near-term bias is looking neutral-to-bullish as the RSI is flatlining above the 50-neutral level, while the MACD oscillator posted a positive crossover within its trigger line above the zero area. Moreover, the bullish crosses within the 20- and 40-simple moving averages (SMAs) and [..]

post-image

Technical Analysis – Apple stock hits another record in exponential uptrend

Posted on January 14, 2020 at 4:06 pm GMT

Apple’s stock price continues to hit record highs after record highs, with the rate of gains increasing exponentially in recent months, something shown by the increasingly steep slope of the uptrend lines that have been supporting the price action. Practically everything paints a bullish picture, with the stock posting higher highs and higher lows above all its moving averages, and above the steepening uptrend lines. The only warning signal comes from the RSI, which seems to have topped deep within [..]

post-image

Technical Analysis – Alcoa stock exits from ascending triangle; lacks direction

Posted on January 14, 2020 at 1:14 pm GMT

Alcoa stock is heading lower and seems to be exiting the squeezed Bollinger band channel and the ascending triangle formation, falling below the 19.48 support. The triangle had been holding since July 2017 when it started the sideline move. From a technical viewpoint, the MACD is losing momentum below its red signal line and the RSI is still hovering in the negative territory but is pointing up, suggesting a possible recovery. Should weakness extend below the 19.48 mark again, support to downside movements could initially be [..]

post-image

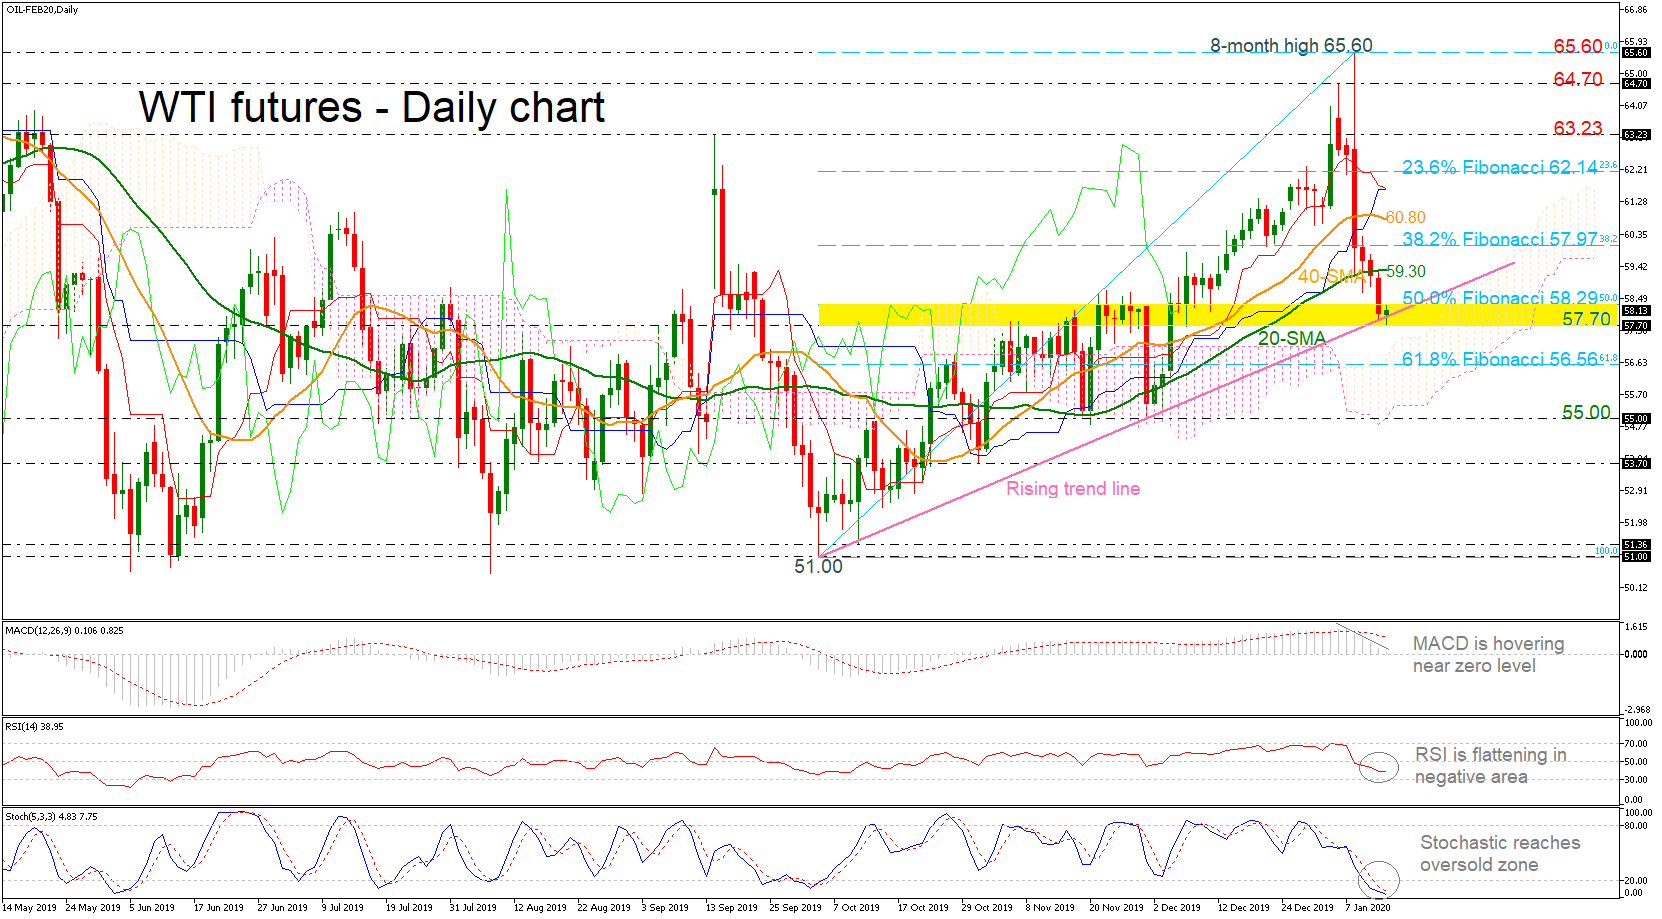
Technical Analysis – WTI oil futures flirt with supportive line; look oversold

Posted on January 14, 2020 at 10:42 am GMT

WTI crude oil futures recorded a significant downfall over the past six days after they found strong resistance at the eight-month high of 65.60 last week. Currently, the price is flirting with the ascending trend line around the 57.70 support level, supposing a possible rebound on it or a breakdown. The negative slope in the RSI, which falls comfortably below its 50 neutral mark, and the downfall of the MACD near its zero line, is painting a bearish picture for [..]

post-image

Technical Analysis – CADJPY remains positive despite pressure from sellers

Posted on January 14, 2020 at 10:32 am GMT

CADJPY is fading following attempts to close a session above the 84.34 resistance from April 2019. Despite the overwhelming positive sentiment – reflected in the upward slopes of the Ichimoku lines and the 20-, 50- and 100-day simple moving averages (SMAs) – the technical indicators suggest a slight weakening in the positive direction. Technically, the MACD, in the positive zone, is flat above its red trigger line, while the RSI, in the bullish region has slightly subsided. Moreover, the Stochastics reflect [..]

post-image

Technical Analysis – AUDCHF turns cautiously negative after multi-month low

Posted on January 14, 2020 at 8:52 am GMT

AUDCHF started the year on the back foot, breaking to the downside the range it had been trading in recent months to briefly touch 0.6620, a level last seen in August. Even though the pair later rebounded, the price structure now consists of lower highs and lower lows, so the outlook seems cautiously negative. A clear break below 0.6620 would turn it firmly negative. Short term oscillators concur with a mildly bearish picture, but also suggest some stabilization in the [..]

Technical Analysis – EURGBP enters bullish zone but key resistance ahead

Posted on January 14, 2020 at 8:16 am GMT

EURGBP is entering bullish territory as the price is deviating above its shorter-term moving averages (SMAs) at the same time the MACD is turning positive after 5 months. The RSI and the red Tenkan-sen line are resuming their positive momentum, backing this view as well. Before turning optimistic however,  the price should first clear the key 0.8600-0.8655 resistance area as any failure to surpass that region could shift the spotlight back to the 0.8470 support level. Lower, the December 9 trough of 0.8392 may [..]

Risk Warning: Your capital is at risk. Leveraged products may not be suitable for everyone. Please consider our Risk Disclosure.