XM does not provide services to residents of the United States of America.

Technical Analysis

post-image

Technical Analysis – US 30 Index consolidates; remains cautiously positive

Posted on January 22, 2020 at 2:33 pm GMT

The Wall Street 30 stock index’s (cash) positive directional momentum appears to have weakened as it has eased slightly from the new all-time-high of 29,401. The index looks to be a bit flat – something also backed by the Ichimoku lines. Moreover, the short-term oscillators reflect a stall in the positive move, with the MACD declining below its red trigger line in the positive zone, and the RSI falling in bullish territory below its latest trendline. That said, the upward [..]

post-image

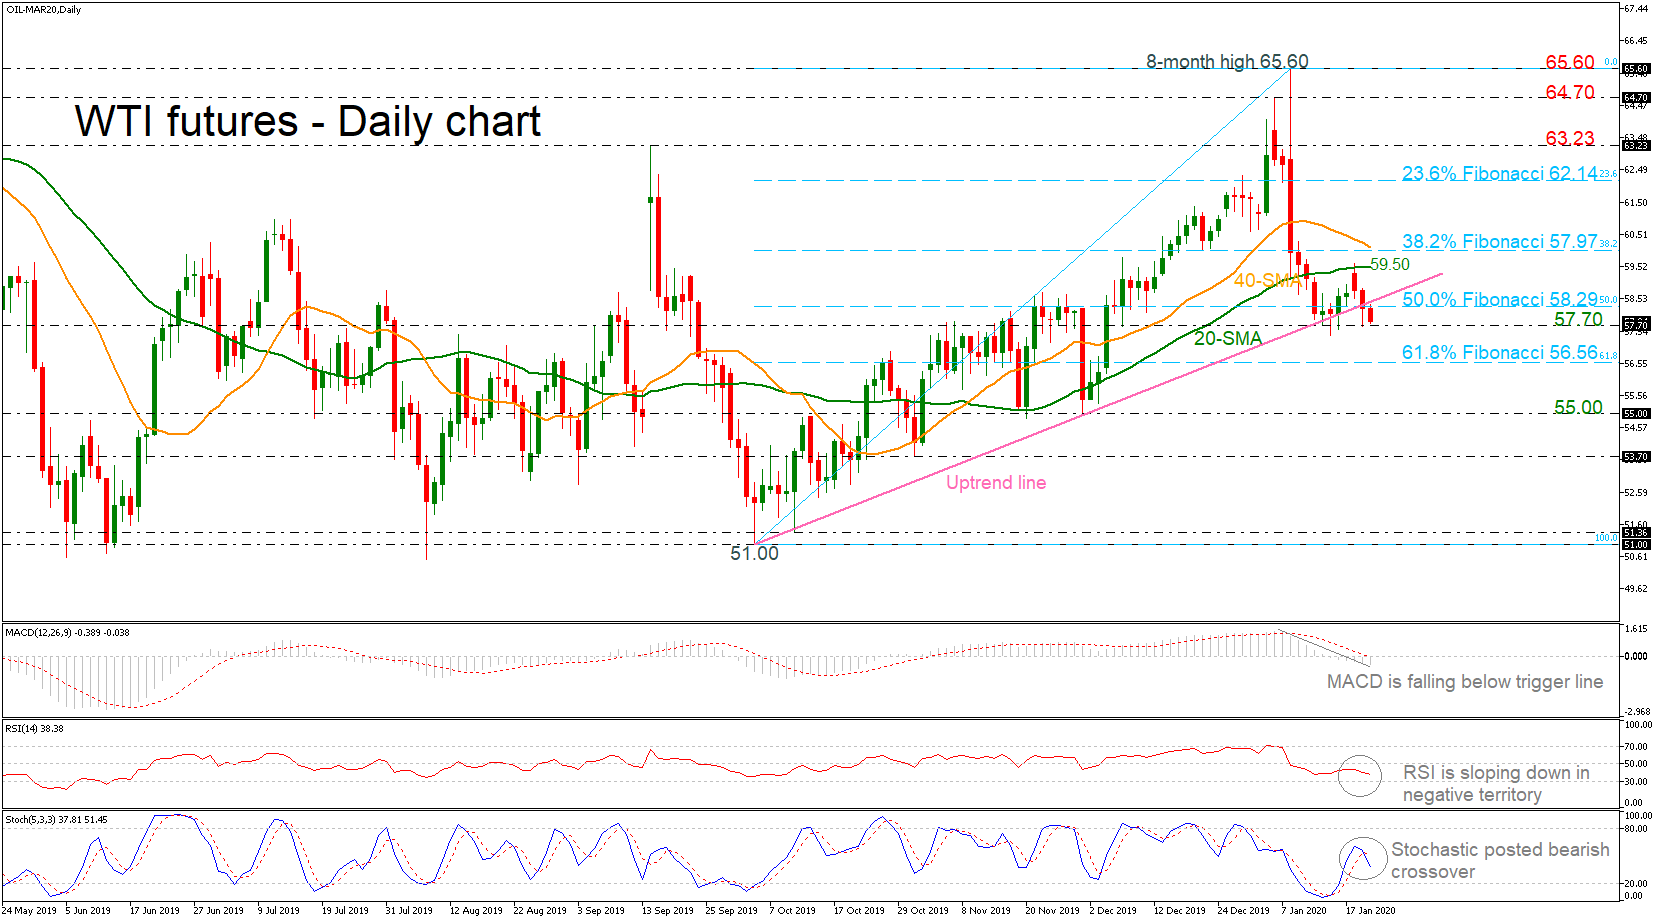
Technical Analysis – WTI futures may have more weakness in store in short term

Posted on January 22, 2020 at 1:19 pm GMT

WTI crude oil futures with delivery in March, are declining below the three-month ascending trend line, creating a bearish-to-neutral view. Momentum indicators are pointing to a negative bias in the short term with the RSI just below 50 and the stochastic oscillator is heading towards the bearish territory. The MACD oscillator is strengthening its downward movement below the trigger and zero line. In addition, the 40-day simple moving average (SMA) is pointing down and approaching the 20-SMA for a possible [..]

post-image

Technical Analysis – Dollar index futures may lengthen bearish trend

Posted on January 22, 2020 at 11:12 am GMT

US dollar index futures are exposed to downside risks as regards the market trend. The first clue is the lower high and the lower lows registered below the 2 ½-year peak of 99.30 and second is the death cross created between the 50- and 200-day simple moving averages (SMA) after more than a year – if sustained. In terms of momentum, the short-term bias is currently viewed as neutral-to-positive as the RSI is moving sideways above its 50 neutral mark and the MACD [..]

post-image

Technical Analysis – US 100 stock index remains near new highs but momentum fades

Posted on January 22, 2020 at 10:41 am GMT

The US 100 stock index is continuing the strong upside rally, creating new record intraday highs every single day over the last four sessions. Today, the price hit the 9222.80 level, remaining well above the short- and long-term simple moving averages (SMAs). The technical indicators are supposing a potential downside correction as both, the RSI and the stochastic, are developing in overbought areas, suggesting the end of the significant gaining period. The RSI is losing momentum above the 70 level [..]

Technical Analysis – AUDUSD appears to be improving; aided by uptrend line

Posted on January 22, 2020 at 9:00 am GMT

AUDUSD is finding substantial upside pressure at the 0.6827 level around where the 100-day simple moving average (SMA) is currently located. Furthermore, the price is retesting a broken downtrend line drawn from December 2018 and the tentative uptrend line pulled from the multi-year low of 0.6670, which is aiding the above outlook. The short-term oscillators reflect mixed signals in directional momentum. The MACD is declining further below its red trigger line and under its zero mark. However, the %K line [..]

Technical Analysis – CADJPY rally loses steam near key resistance; uptrend still intact

Posted on January 22, 2020 at 8:27 am GMT

CADJPY bulls run out of fuel near a 10-month high of 84.55 and the 61.8% Fibonacci of the 89.20-76.63 downleg recorded between the 2018 October-January period. The easing momentum in the RSI and the MACD suggests that weakness may remain in the market in the short-term as the former is holding a downward direction and the latter is ready to cross below its red signal line. On the positive side, the pair is trading in an uptrend in the medium-term [..]

post-image

Technical Analysis – EURGBP consolidates in tight range in near term  

Posted on January 22, 2020 at 7:40 am GMT

EURGBP is consolidating within a tight trading range over the last month with an upper boundary at the 0.8590 resistance and the lower boundary at the 0.8450 support level. Currently, the pair is capped by the short-term moving averages and the 23.6% Fibonacci retracement level of the downward wave from 0.9324 to 0.8275 near 0.8520, suggesting a potential breakdown of the channel. The technical indicators are flattening, confirming the recent view in the daily timeframe. The MACD is moving with [..]

post-image

Technical Analysis – USDMXN appears bearish, capped by restrictive trendline

Posted on January 21, 2020 at 4:36 pm GMT

USDMXN pierced under the low of 18.73 from 17 October 2018 and is currently testing the trendline, limiting upside corrections drawn from December 3, 2019. Further backing the negative picture is the downward sloping 50- and 100-day simple moving averages (SMAs) and the near completion of a bearish crossover of the 200-day SMA by the 100-day one. That said, the short-term oscillators are reflecting mixed signals for now. The MACD, in the negative region, is above its red trigger line [..]

post-image

Technical Analysis – UK 100 stock index retreats below MAs; losses halted by Ichimoku cloud

Posted on January 21, 2020 at 2:53 pm GMT

UK 100 Stock Index (cash) retraced from the five-month high of 7,689 below the simple moving averages (SMAs) on the four-hour chart but further losses were restricted by the Ichimoku cloud’s lower boundary at 7,557. The short-term oscillators reflect mixed signals in momentum. The MACD sponsors negative momentum as it is below its red trigger line and has just slipped below the zero mark, whereas, the RSI is rising after reversing ahead of the 30 oversold level, promoting a pickup [..]

Technical Analysis – GBPUSD’s retracement turns sideways; nears ascending trendline

Posted on January 21, 2020 at 9:22 am GMT

GBPUSD looks to be a bit flat around the 1.3010 level, which is the 38.2% Fibonacci retracement of the up leg from 1.2194 to 1.3514. With the recent lower highs and higher lows, the pair could extend its sideways nature further into the Ichimoku cloud and possibly down towards the lower band of the cloud and the supportive trendline. The technical indicators suggest that directional momentum has evaporated but favor a very short-term negative move. The MACD is below its [..]

Risk Warning: Your capital is at risk. Leveraged products may not be suitable for everyone. Please consider our Risk Disclosure.