XM does not provide services to residents of the United States of America.

Technical Analysis

post-image

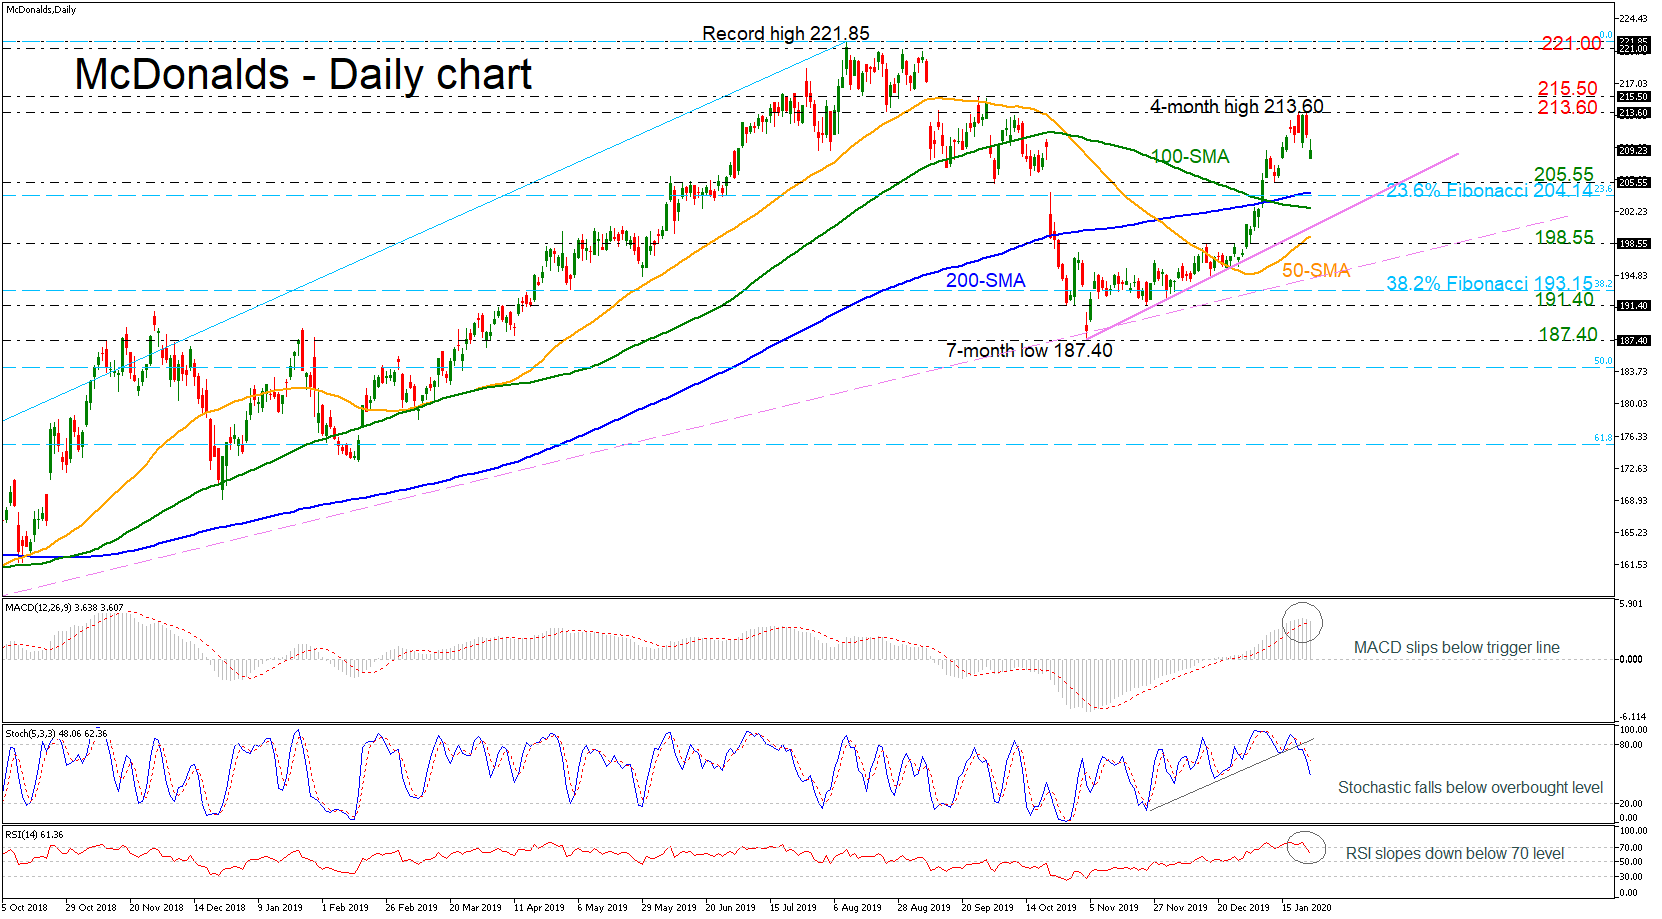
Technical Analysis – McDonald’s tries to recover fresh gap; bullish in short-term

Posted on January 28, 2020 at 11:12 am GMT

McDonald’s stock price is trying to pare the negative gap that posted yesterday in the daily timeframe, however, the technical indicators are continuing the negative movement. The MACD is dropping below its trigger line in the positive zone, while the stochastic indicator is strengthening its downside structure below the overbought zone. Moreover, the RSI is sloping down with strong momentum above the 50 level. Should weakness extend even lower, support to a negative move could be initially detected within the [..]

Technical Analysis – WTI futures remains bearish despite recent pullback

Posted on January 28, 2020 at 9:21 am GMT

WTI oil futures appears to be sustaining its very short-term bearish picture despite the oscillators currently reflecting an improvement in positive momentum. Further aiding the move south are the downward sloping 20-, 50- and 100-period simple moving averages (SMAs) and their bearish crossovers of the 200-period SMA. The MACD has climbed above its red trigger line deep in the negative zone, while the RSI, currently in the oversold territory, is flirting with the 30 level. Noteworthy though, is the restrictive [..]

Technical Analysis – GBPUSD faces symmetrical triangle; broader trend is bullish

Posted on January 28, 2020 at 7:53 am GMT

GBPUSD is lacking direction over the last five weeks, creating a symmetrical triangle in the short-term after reversing from the 14-month high of 1.3515. When looking at the bigger picture, the pair has a clear bullish trend since September 2019 but technical indicators are confirming the recent neutral mode. The RSI is declining slightly below the 50 neutral level, while the MACD oscillator is failing to strengthen its momentum near the zero line. Currently, the price is hovering below the 20- and 40-simple moving averages (SMAs) [..]

post-image

Technical Analysis – Boeing stock rebounds near one-year low but bullish signals still missing

Posted on January 27, 2020 at 3:41 pm GMT

While other US stocks keep enjoying record highs, Boeing remains on the sidelines since the sharp sell-off from the 445.08 peak on March 2019. The bears have recently tried to touch the 2018 trough of 292.13 without success, with the price rebounding just a shy of the 300.00 level instead. In the coming sessions the stock could follow a sideways move if the RSI keeps moving towards its 50 neutral mark and the MACD continues to improve towards its red signal line. [..]

post-image

Technical Analysis – USDCNH appreciates despite looming medium-term downtrend

Posted on January 27, 2020 at 2:51 pm GMT

The Renminbi’s recent push up from 6.8440 has returned the pair to levels seen at the end of last year. Buyers are attempting to breach an important region from 6.9790 to 6.9865 on the daily timeframe, where a bearish crossover of the 200-day simple moving average (SMA) by the 50-day one currently resides. The short-term oscillators suggest positive momentum is strengthening, backing the improving picture in the price action. The MACD is strengthening above its red trigger line in the [..]

post-image

Technical Analysis – Visa stock adopts bearish behavior but trend reversal not on the cards yet

Posted on January 27, 2020 at 1:57 pm GMT

Visa’ stock topped its rally at an all-time high of 210.03 last Thursday before retreating slightly. Even though the market seems to have printed a bearish shooting star candle in the aforementioned day, there are no serious concerns of a trend reversal yet as long as the price trades above its previous high of 186.63. However, in the short-term, downside corrections or at least some consolidation is possible given the stabilizing MACD and the weakness in the RSI, which is [..]

post-image

Technical Analysis – CHI 50 index dives below 200-day SMA; bearish mood to persist

Posted on January 27, 2020 at 10:34 am GMT

China’s 50 stock index (CHI50) opened with a gap down on Monday and below the 200-day simple moving average (SMA) after posting its sharpest weekly loss in almost a year. The bears are currently pushing efforts to close below the 38.2% Fibonacci of the upleg from 10,197 to 14,678 and although the RSI and the Stochastics are flashing oversold conditions, the short-term indicators are still pointing downwards along with the MACD, all providing negative warnings for the coming sessions. Yet, room [..]

Technical Analysis – Gold eyes tops as momentum picks up

Posted on January 27, 2020 at 9:45 am GMT

Gold today gapped up and seems to be taking a breather around the 1,575 level, which is the 23.6% Fibonacci retracement of the up leg from 1,458.42 to 1,611.28 after bouncing off the joined 50- and 100-period simple moving averages (SMAs). This view is also reflected in the Ichimoku lines, which are currently flat. The short-term oscillators suggest a pause in momentum but lean towards the positive picture. The MACD is rising above its red trigger line in the positive [..]

Technical Analysis – EURUSD reaches 8-week low; more losses are expected

Posted on January 27, 2020 at 7:39 am GMT

EURUSD has been underperforming in the past two days, breaking the almost four-month old ascending trend line to the downside. The price reached an eight-week low around 1.1019, distancing itself from the Ichimoku cloud and the short-term moving averages in the daily timeframe. Momentum indicators are pointing to a negative bias in the short term as the RSI is hovering above its 30 oversold mark but below 50 and the stochastic oscillator is flattening in the bearish territory, both confirming the recent downward [..]

post-image

Technical Analysis – GBPCHF looks undecided after its pullback off the December 2019 high

Posted on January 24, 2020 at 1:06 pm GMT

GBPCHF’s correction from the seven-month high of 1.3307 bounced off the 200-day simple moving average (SMA) and is now confined between the downward sloping 40-day SMA and the flat 20-day one, located at 1.2682, which is the 38.2% Fibonacci retracement of the up leg from 1.1671 to 1.3307. The short-term oscillators are reflecting mixed signals in momentum. The MACD in the negative zone has moved above its red trigger line, while the Stochastics’ %K line has deflected off the 80 [..]

Risk Warning: Your capital is at risk. Leveraged products may not be suitable for everyone. Please consider our Risk Disclosure.