XM does not provide services to residents of the United States of America.

Technical Analysis

post-image

Technical Analysis – EURAUD bears face big challenge at 1.6430

Posted on February 4, 2020 at 1:29 pm GMT

EURAUD held in losses for the second day in a row after flirting with a fresh five-month peak of 1.6590. The drop to the 23.6% Fibonacci retracement level of the upward move from 1.5340 – 1.6790 and near the 1.6430 key support, has sustained the neutral mode in the medium-term. The RSI in the daily chart continues to lose direction in the positive area, while the stochastic is creating a bearish cross within the %K and %D lines in the overbought zone. [..]

post-image

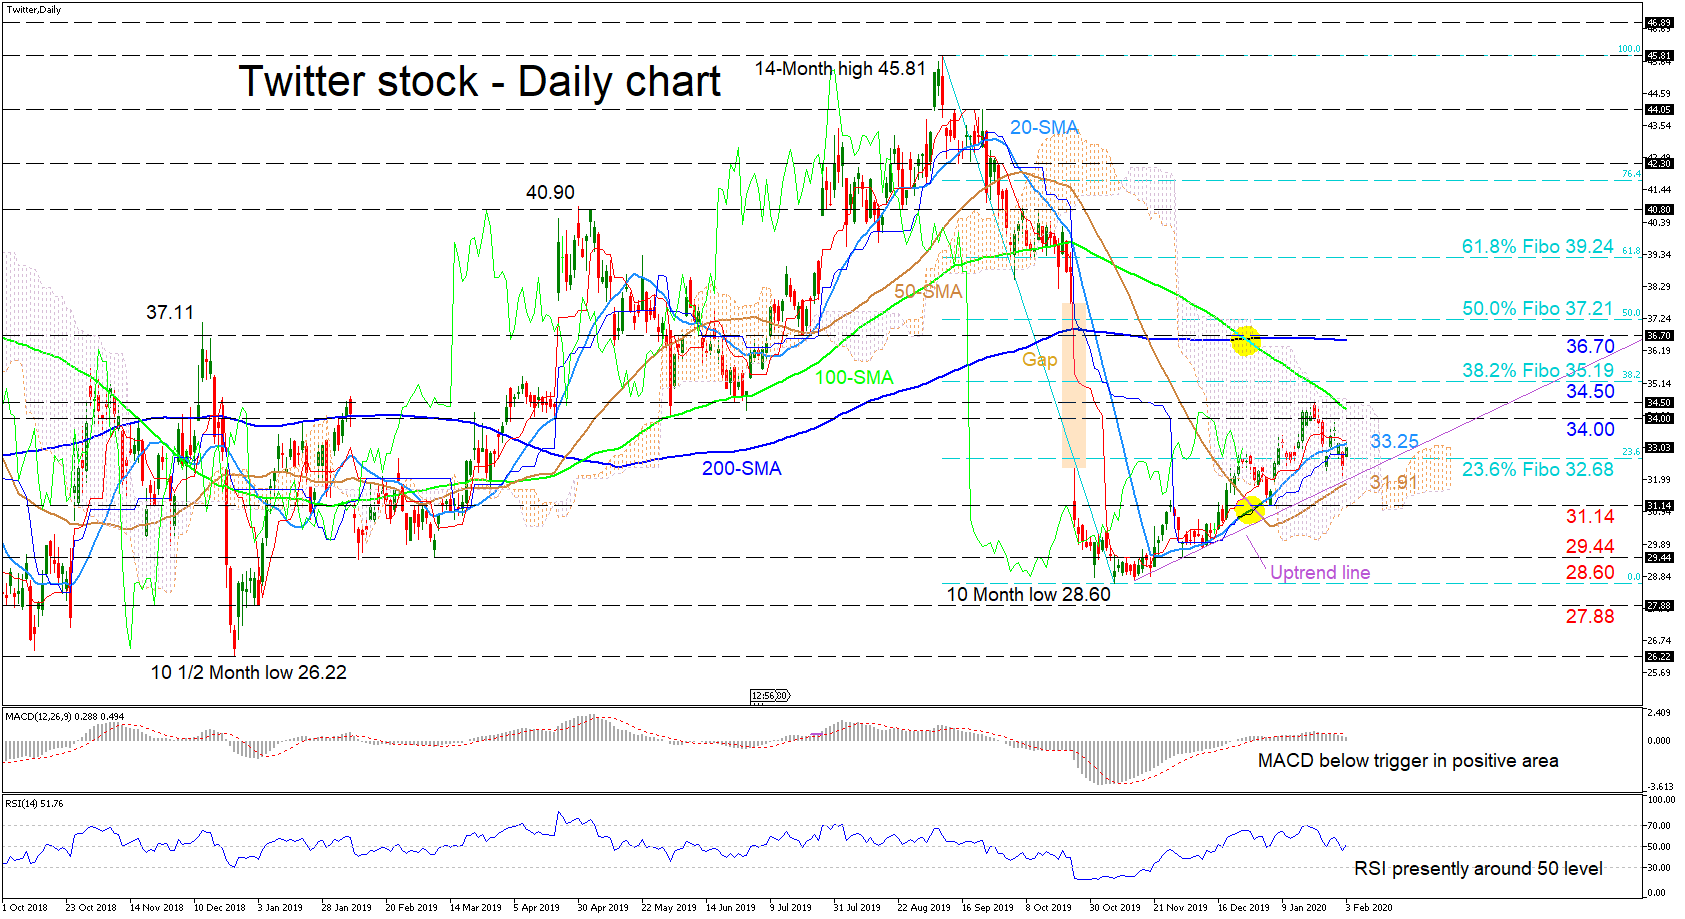
Technical Analysis – Twitter stock pauses above uptrend line; loads for next direction

Posted on February 4, 2020 at 10:43 am GMT

Twitter stock is currently consolidating around 32.68 – which is the 23.6% Fibonacci retracement of the down leg from 45.81 to 28.60 – capped by the 20-day simple moving average (SMA) and supported by the 50-day SMA and uptrend line drawn from 14 November 2019. Backing this view are the momentum oscillators, the flat 200-day SMA and Ichimoku lines. The MACD has slipped below its red trigger line but both are still hovering slightly above zero, while the RSI is [..]

post-image

Technical Analysis – WTI oil futures bounce on 1-year trough; outlook remains bearish

Posted on February 4, 2020 at 10:41 am GMT

WTI futures recorded a fresh one-year low of 49.64 earlier today before turning higher, approaching the descending trend line, which has been holding since January 8.   Looking at the momentum oscillators on the 4-hour chart though, they suggest further increases may be on the cards in the short-term. The RSI has started to slope north again, while the stochastic oscillator is also heading up after it posted a bullish crossover within the %K and D% lines. Should oil breach the descending trendline, the next resistance could come the 52.00 handle and the 40-period SMA at 52.46. [..]

post-image

Technical Analysis – EURCHF seems to have found a floor; nearby resistance eyed for confirmation

Posted on February 4, 2020 at 10:36 am GMT

EURCHF looks to be creating a floor around a fresh 33-month low of 1.0662 as the RSI and the MACD seem to have reached a bottom in bearish territory and are now changing direction to the upside. Traders, however, would be more eager to engage in buying activities if the price manages to surpass the nearby resistance at 1.0757, where the 23.6% Fibonacci of the 1.1058-1.0662 downleg is placed. If this is successfully breached, then the rally may next rest somewhere between 1.0830, [..]

Technical Analysis – GBPAUD to keep bearish mood in short-term

Posted on February 4, 2020 at 8:34 am GMT

GBPAUD turned overbought near a fresh 3 ½-year high of 1.9750 last week, with the price drifting south along with the RSI and the MACD, which signal a bearish bias for the short-term in the four-hour chart. The price itself is providing negative signals too as it is currently trying to close below the 50-period simple moving average (SMA) and the 38.2% Fibonacci of the 1.8550-1.9750 upleg after breaching the supportive 20-period SMA. Should the sell-off continue, the 50% Fibonacci of 1.9200 should be the [..]

Technical Analysis – GBPUSD plunges below 1.3000; lacks direction in near term

Posted on February 4, 2020 at 7:52 am GMT

GBPUSD tumbled on Monday, falling back below the 1.3000 handle and the short-term moving averages (SMAs) in the daily timeframe. The price is flirting with the five-month ascending trendline, aiding in confining the price within a sideways move and dropping below the nearby low levels. However, the technical indicators are signaling a lacking direction. The RSI is flattening marginally below the 50 level, while the MACD oscillator is moving sideways near its trigger and zero lines over the last three weeks. Moreover, the horizontal moving averages are implying a [..]

post-image

Technical Analysis – Disney’s stock gaps back above 100-day SMA after consolidation

Posted on February 3, 2020 at 3:18 pm GMT

Disney stock’s two-month descent, from the all-time-high of 153.33 stalled at 135.74, which is the 38.2% Fibonacci retracement of the up leg from 107.28 to 153.33. Presently, the stock appears undecided as it has gapped back above the flattened 200- and 100-day simple moving averages (SMAs), which back this notion. The MACD in the negative area, though below its red trigger line, is strengthening, while the RSI is improving in bearish territory. The Stochastics are bullish and rising after having [..]

post-image

Technical Analysis – USDCNH challenges falling trend line above 7.0000

Posted on February 3, 2020 at 1:49 pm GMT

USDCNH seems to be stronger over the last three trading days, challenging the five-month descending trendline and the upper band of the Ichimoku cloud, near the 7.0126 resistance level. The technical indicators are feeding prospects for a possible positive short-term move above the falling trendline, as the RSI holds well above 50 and is pointing up, while the MACD continues to strengthen in the bullish territory and above its red trigger line.  Also, in Ichimoku indicators, the red Tenkan-sen line keeps rising above the blue Kijun-sen line. If 7.0126 proves easy [..]

post-image

Technical Analysis – Google bears eye 1,420 for more downside in short-term

Posted on February 3, 2020 at 12:14 pm GMT

Google stock shifted south after peaking at an all-time high of 1,501 on January 22 but the bears should push below 1,370 and under the ascending trendline to put the upward pattern in the bigger picture in doubt. In the near-term, the focus will be on the 1,420 level as the RSI and the MACD suggest a neutral-to-bearish bias for the coming sessions. This is also where the 23.6% Fibonacci of the 1,159-1,501 upleg meets the 50-period simple moving average (SMA). [..]

post-image

Technical Analysis – EURNOK accelerates to 2-month high; key resistance ahead

Posted on February 3, 2020 at 11:10 am GMT

EURNOK opened positive on Monday, continuing last week’s remarkable rally to two-month high of 10.27. The RSI is still sloping upwards, but it is already above its 70 overbought mark, hinting that downside corrections or some stabilization is possible in the near-term, with the fast Stochastics which reversed north again endorsing this view as well. On the way up, there is a tall wall between 10.27 and the multi-year high of 10.31 and only a decisive close above it could [..]

Risk Warning: Your capital is at risk. Leveraged products may not be suitable for everyone. Please consider our Risk Disclosure.