XM does not provide services to residents of the United States of America.

Technical Analysis

post-image

Technical Analysis – Are palladium futures completing a bullish cycle?

Posted on February 6, 2020 at 10:41 am GMT

Palladium futures have been well supported by the 20-day simple moving average (SMA) recently, but the bulls seem to be struggling to overcome previous record high levels around 2,400, with the price registering a negative candle on Wednesday. The price continues to lose ground on Thursday, increasing speculation of a bearish double top pattern as the momentum indicators are shifting south; the RSI and the Stochastics topped near overbought levels and are turning lower, while the MACD seems to be [..]

post-image

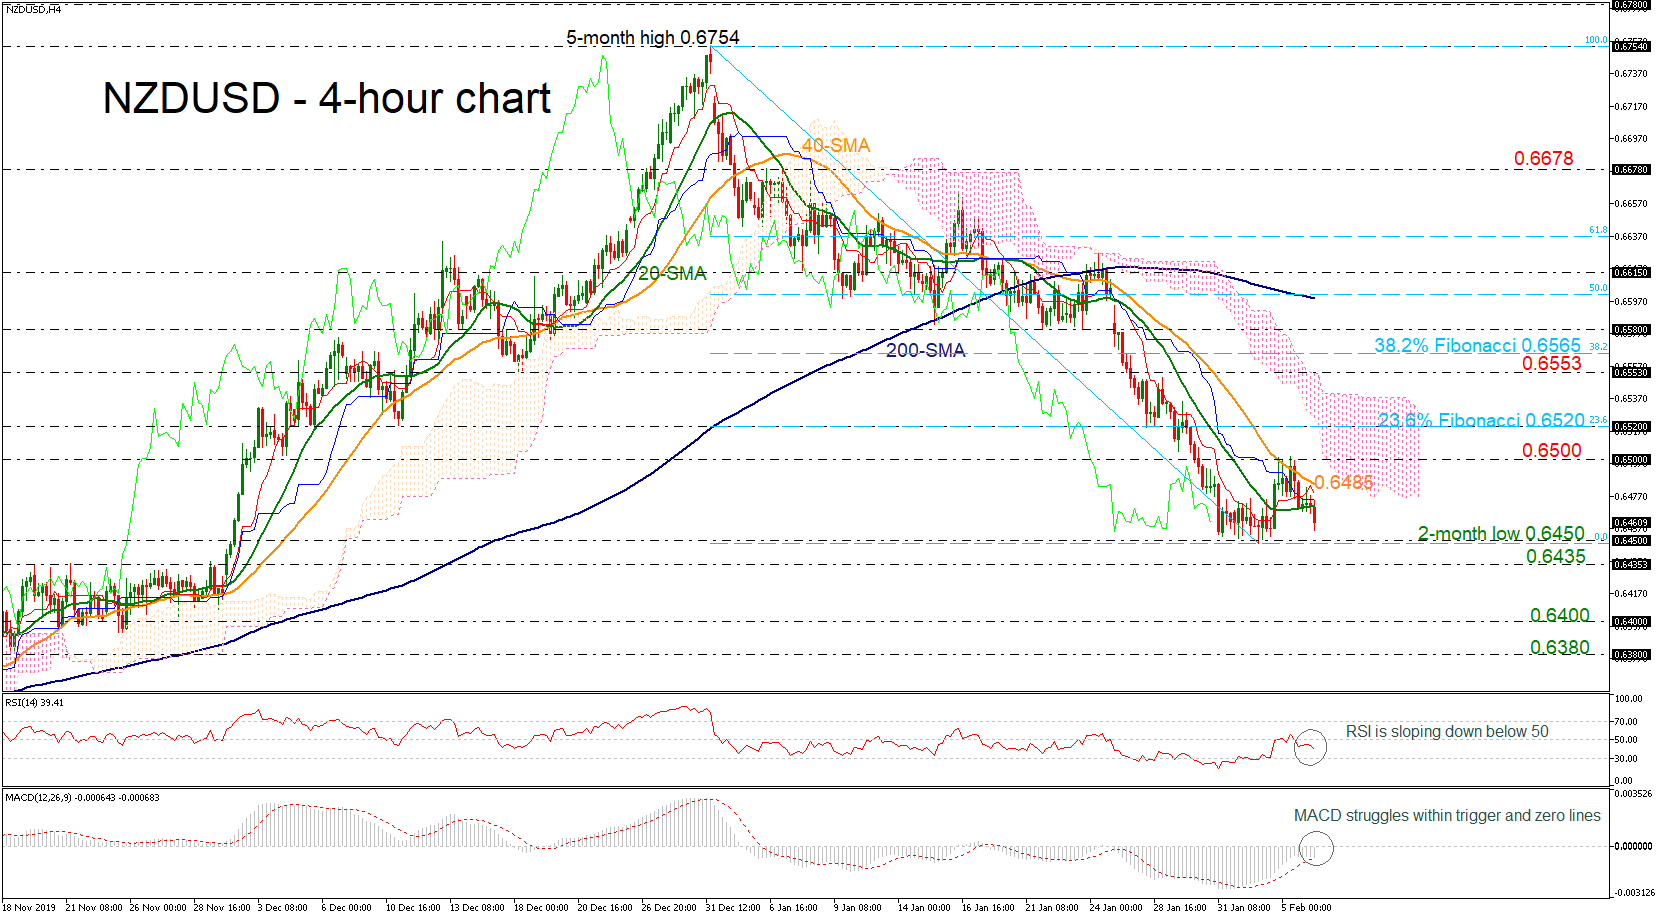
Technical Analysis – NZDUSD holds bearish bias near 2-month trough

Posted on February 6, 2020 at 10:09 am GMT

NZDUSD has been on the sidelines for most of the week as the two-month low of 0.6450 and the 0.6500 handle seem to be a real struggle for traders. Technically, the price could lose some ground in the short-term as the RSI is changing direction to the downside and towards its 30 mark, while the MACD oscillator is approaching its trigger line to create a bearish cross below the zero line. In the last 4-hour session, the price dropped below the 20-day simple [..]

Technical Analysis – USDCHF bulls need to break 0.9770 to take over

Posted on February 6, 2020 at 8:03 am GMT

USDCHF started the month on the right foot, with the price refusing to revisit the 15-month low of 0.9612 and instead rebounding back to the 0.9700 region this week. While bullish pressure seems to be gathering as the RSI is pushing efforts to expand above its 50 neutral mark and the MACD is increasing positive momentum above its red signal line, it remains to be seen whether the price can hold around the upper Bollinger band and more importantly surpass the 38.2% [..]

Technical Analysis – USDJPY finds wall near 110.00; fresh 2-week high

Posted on February 6, 2020 at 7:19 am GMT

USDJPY had an impressive bullish rally over the last three daily sessions, finding strong support at the five-month ascending trend line and the 108.30 barrier. Earlier today, the price recorded a new two-week high near the strong 110.00 psychological number, successfully surpassing the 20- and 40-day simple moving averages (SMAs). From a technical viewpoint, the stochastic entered in the overbought zone and is still pointing north, while the RSI indicator is gradually moving up into the positive territory. Both are [..]

post-image

Technical Analysis – JP 225 index looks for some extra gains in short-term

Posted on February 5, 2020 at 2:22 pm GMT

Japan’s 225 stock index staged an impressive rally earlier on Wednesday to cross above the Ichimoku cloud and close on top of the 200-period simple moving average (SMA) on the four-hour chart. Technically, there is still some room for improvement as the Stochastics are reversing north again within the overbought area at a time when the RSI keeps rising to reach its 70 overbought mark. The 23,700 level seems like a hurdle for the bulls at the moment but if it soon falls [..]

post-image

Technical Analysis – EURNZD seems to have found a ceiling; bearish bias in near term

Posted on February 5, 2020 at 1:47 pm GMT

EURNZD has come under renewed selling pressure and has fallen back below the 1.7000 handle, though it remains inside the Ichimoku cloud. The technical indicators are falling simultaneously with the price, as the RSI found a wall at the 70 level and declined sharply lower, while the stochastic created a bearish cross with its %K and %D lines in the oversold zone. However, the 20 and 40-day simple moving averages (SMAs) completed a bullish cross, confirming the upside move towards [..]

post-image

Technical Analysis – US 500 index flirts with record high; more gains expected

Posted on February 5, 2020 at 11:10 am GMT

The US 500 index has advanced considerably – as it found a strong support at the 50-day simple moving average (SMA) – and is heading towards the all-time high of 3,337.64. Looking at momentum indicators, the RSI is sloping up slightly above its neutral threshold of 50, suggesting that the market could keep rising in the near term. The rising MACD also supports this view, currently in the positive territory attempting to embrace its red signal line. A further move to the [..]

Technical Analysis – EURJPY bounces back above 200-day SMA but bulls look weak

Posted on February 5, 2020 at 8:20 am GMT

EURJPY regained positive momentum within the 120.00 territory on Tuesday after failing to breach support around 119.76. The pair jumped back above the 200-day simple moving average (SMA) but could not enter the Ichimoku cloud from below nor rise above the broken ascending trendline. Currently the momentum indicators provide little hope for a meaningful rally in the short-term as the RSI seems to be losing steam just below its 50 neutral level, while the Stochastics are not far below overbought levels, suggesting [..]

Technical Analysis – AUDUSD completes inverted hammer after rebound on 4-month low

Posted on February 5, 2020 at 7:45 am GMT

AUDUSD is looking more bullish after completing an inverted hammer pattern on Tuesday – implying a reversal move – once it posted a new four-month low of 0.6680. The strong sell-off started from the six-month high of 0.7030 but the technical indicators are suggesting a potential pullback in the short-term. The RSI is flattening after the jump back into the bearish territory from the oversold zone, while the rising stochastic oscillator completed a bullish cross exiting the oversold area. A [..]

post-image

Technical Analysis – USDTRY capped near multi-month high, but trend still positive

Posted on February 4, 2020 at 4:18 pm GMT

USDTRY hit a wall near 5.985 lately – the region that also halted the advance in early January – and subsequently retreated a little. That said, the price structure still consists of consecutive higher highs and higher lows above both the 50- and 200-day simple moving averages (SMAs), so the overall picture remains very much positive. A break below 5.84 is needed to bring the bullish outlook into question. Short term oscillators paint a mixed picture. The RSI, having met [..]

Risk Warning: Your capital is at risk. Leveraged products may not be suitable for everyone. Please consider our Risk Disclosure.