XM does not provide services to residents of the United States of America.

Technical Analysis

post-image

Technical Analysis – Dollar index reactivates 2-year old uptrend in overbought zone

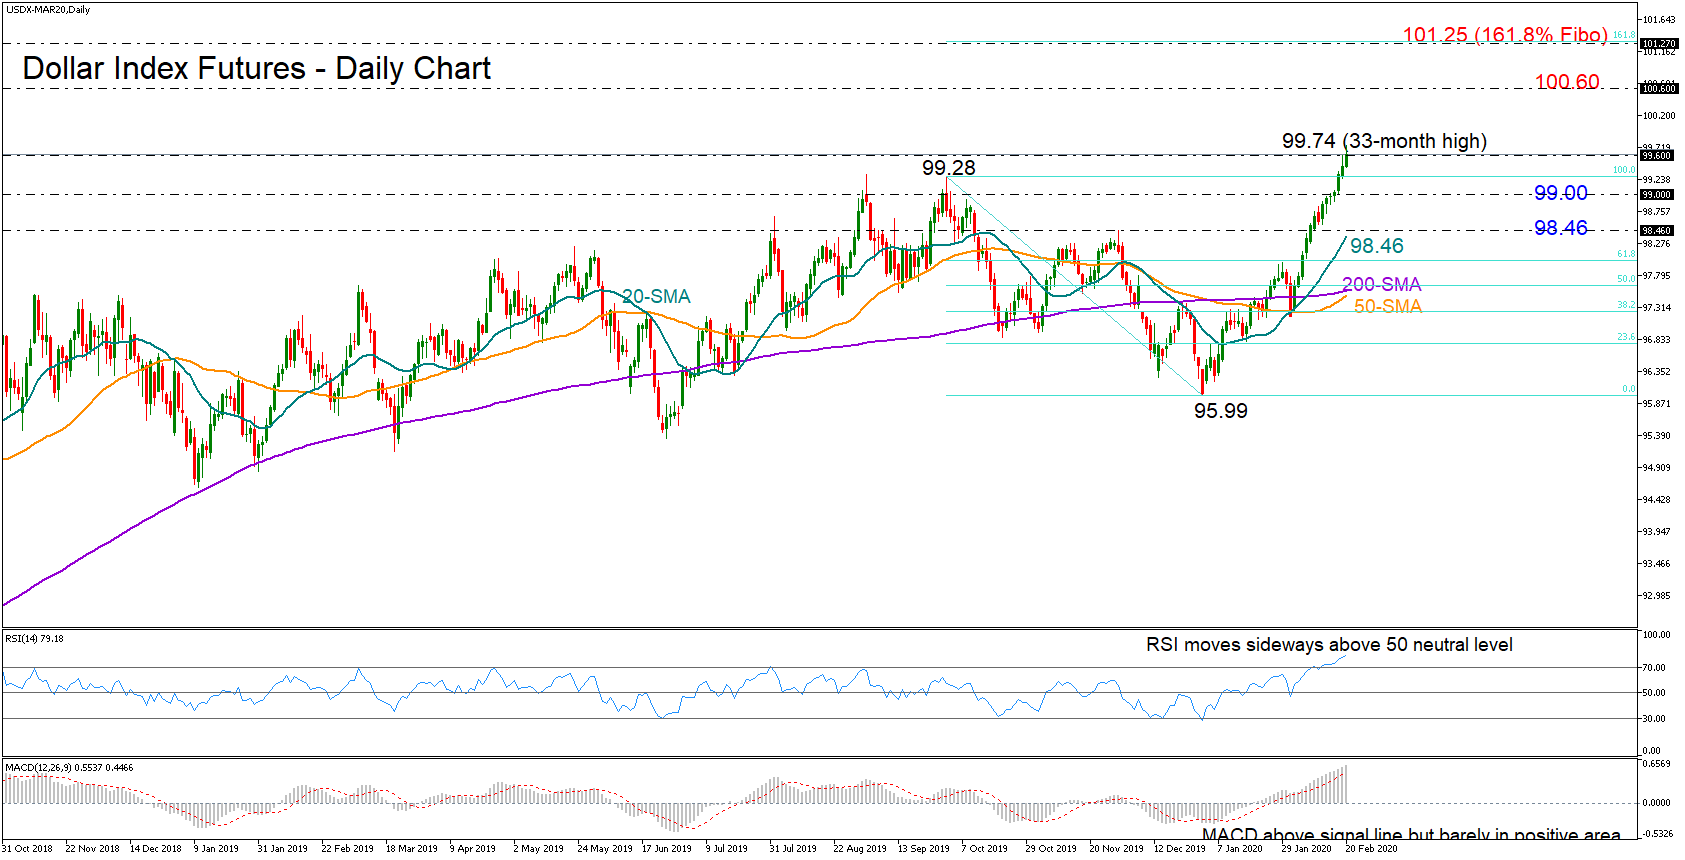
Posted on February 20, 2020 at 9:27 am GMT

The US dollar index futures cleared the tough ceiling around 99.30 and spiked to a 33-month high of 99.74 on Thursday, re-activating the two-year old upward pattern off 88.13. If the bulls manage to close decisively above the former resistance level of 99.60 from 2015, the next key obstacle is expected to pop up around 100.60. Since the RSI and the MACD have yet to show signs of weakness, the odds for such a case are currently looking high. If [..]

Technical Analysis – GBPJPY eyes upper boundary of 2-month sideways market

Posted on February 20, 2020 at 8:27 am GMT

GBPJPY is currently improving off the 143.80 level, which is the 23.6% Fibonacci retracement of the up move from 130.42 to 147.95. The near completion of the bullish crossover of the 200-period simple moving average (SMA) by the 50-period one seems to have further aided in the very short-term incline from February 10 that bounced off the 38.2% Fibo of 141.24. Looking at the short-term oscillators, they suggest a pickup in positive sentiment. The MACD, in the positive zone, is [..]

post-image

Technical Analysis – NZDUSD dives to 3-month low; trend signals bearish

Posted on February 20, 2020 at 8:24 am GMT

NZDUSD could not overcome the key 0.6485 restrictive area last week, reversing south to unlock a three-month low of 0.6344 early on Thursday. The price is currently approaching a support zone near 0.6325 which could keep the bears busy in the short-term as the oversold status in the RSI and the Stochastics suggest, while the presence of the lower Bollinger band in the neighborhood is also increasing the case. That said, the bearish cross between the 20- and 200-day simple moving [..]

Technical Analysis – USDJPY unlocks 9-month highs; strongly bullish

Posted on February 20, 2020 at 7:20 am GMT

USDJPY has an impressive upside rally on Wednesday’s trading session, surging to a fresh nine-month high of 111.58 and also recovering the gap that was created last May. The aggressive run helped the pair to add more than 150 pips in just one day, increasing the distance from the rising trend line. However, the momentum indicators are overbought, and a downside retracement may be on the cards in the next sessions. The %K line of the stochastic jumped above the [..]

post-image

Technical Analysis – Copper futures’ 2-week pullback from lows loses steam

Posted on February 19, 2020 at 3:50 pm GMT

Copper futures are facing renewed selling interest, though prices are currently seeking support from the 2.5780 level – which is the 23.6% Fibonacci retracement of the down leg from 2.8819 to 2.4839 – and the 100-period simple moving average (SMA) just below it at 2.5740. Looking at the short-term oscillators, negative momentum appears to be picking up. The MACD, currently at the zero mark, is only just below its red trigger line and seems to be trying to move into the negative zone, while [..]

post-image

Technical Analysis – Palladium futures unlock another record high at 2,752; 17% up this month

Posted on February 19, 2020 at 3:41 pm GMT

Palladium futures for March delivery seem unwilling to stop the extraordinary rally in uncharted territory, with the price flying as high as 2,752 on Wednesday after a short consolidation period within the 2,424-2,148 zone. The higher highs and higher lows remain well intact in the market’s bullish structure, while the shorter-term simple moving averages continue to fluctuate above the longer-term SMAs, all pointing to a stronger uptrend in the coming sessions. Some stabilization cannot be ruled out as the RSI [..]

post-image

Technical Analysis – CADJPY rallies to 1-month high; rises in upward sloping channel

Posted on February 19, 2020 at 2:15 pm GMT

CADJPY is in a flying mode today as it surges above the 50-day simple moving average and the 23.6% Fibonacci retracement level of the up leg from 78.48 to 84.55 near 83.11, stretching its upward pattern towards a one-month high. According to the RSI, positive momentum could push for further gains in the short-term as the indicator picks up steam above its 50 level. The stochastic is also advancing, though, it is relatively close to the overbought threshold; negative corrections cannot be excluded should [..]

post-image

Technical Analysis – EURGBP stops near 2½-year low; neutral zone intact

Posted on February 19, 2020 at 10:42 am GMT

EURGBP is trading near its weakest level since 2017, following a plunge from the 0.8385 barrier in the preceding week. The pair created a consolidation area from 0.8275 to 0.8590 since December 13 but is still moving below the short- and medium-term moving averages, confirming the long-term bearish structure from the ten-year peak of 0.9324. From a technical viewpoint, the momentum indicators seem to be in confusion as the MACD is holding below its trigger line, which supports the bearish view [..]

post-image

Technical analysis – EURJPY’s efforts attempt a pullback in the ruling bearish picture

Posted on February 19, 2020 at 9:23 am GMT

EURJPY is currently aggressively overtaking the mid-Bollinger band and the 118.96 resistance level, after having pivoted at the 118.46 support (an inside swing high from 27 September 2019), thus producing a four-month low. Despite the prevailing one-month decline reflected in the downward sloping simple moving averages (SMAs) and by the tentative downtrend line, buyers’ efforts seem to be aided by the short-term oscillators, which are reflecting a pickup in positive sentiment. The MACD, in the negative region, has moved back [..]

post-image

Technical Analysis – Silver jumps above 18.00 and into overbought zone

Posted on February 19, 2020 at 8:21 am GMT

Silver staged a remarkable rally beyond the 18.00 number after closing above the 200-period simple moving average (SMA) on the four-hour chart on Tuesday. With the RSI signaling overbought conditions and the price currently testing a former resistance area which is near the 23.6% Fibonacci of the long upleg from 13.87 to 19.63 (November 2018- September 2019), there is an increasing possibility of a downside correction. In this scenario, the price is expected to retreat to 18.13, where it recently [..]

Risk Warning: Your capital is at risk. Leveraged products may not be suitable for everyone. Please consider our Risk Disclosure.