XM does not provide services to residents of the United States of America.

Technical Analysis

post-image

Technical Analysis – Tesla stock continues descent; retraces until the 76.4% Fibonacci

Posted on March 17, 2020 at 6:02 pm GMT

Tesla’s stock price has corrected from the all-time highs piercing below the 50- and 100-day simple moving averages (SMAs) to touch a nearly three-month low of 394.97, which is just below the 76.4% Fibonacci retracement of the up leg from 218.21 to 967.49, of 395.83. The whole aggressive down move, which began on February 19, seems to have stalled around the 76.4% Fibo of 395.83. That said the MACD, in the negative region, is currently declining below its red trigger [..]

post-image

Technical Analysis – EURCAD sets sight on peak despite recent correction

Posted on March 17, 2020 at 3:09 pm GMT

EURCAD continues to focus on the recent 23-month-peak of 1.5817 even after a pullback below the 1.5449 level, which is the 23.6% Fibonacci retracement of the up leg from the 1.4263 to 1.5817. The picture appears to suggest that further advances could unfold, aided by the recent bullish crossover in the stochastic lines with room to move, as well as the nearing of a bullish cross between the 200-day simple moving average (SMA) and the 100-day one. Moreover, the upward [..]

post-image

Technical Analysis – EURAUD rollercoaster continues to fresh 11-year peak; next level 1.86

Posted on March 17, 2020 at 1:00 pm GMT

EURAUD is still extending its bullish rollercoaster to a fresh eleven-year peak of 1.8415, posting its fifth consecutive green day. The moving average lines are following the price’s action and are pointing north. Additionally, the RSI indicator is hovering in the overbought territory with weaker momentum than before, while the stochastic is edging higher above the 80 level. On the upside, the price could attempt to overcome the eleven-year high and test the 1.8600 round level, which has been standing [..]

post-image

Technical Analysis – Boeing stock faces worst decline in history; eyes crucial support area

Posted on March 17, 2020 at 10:59 am GMT

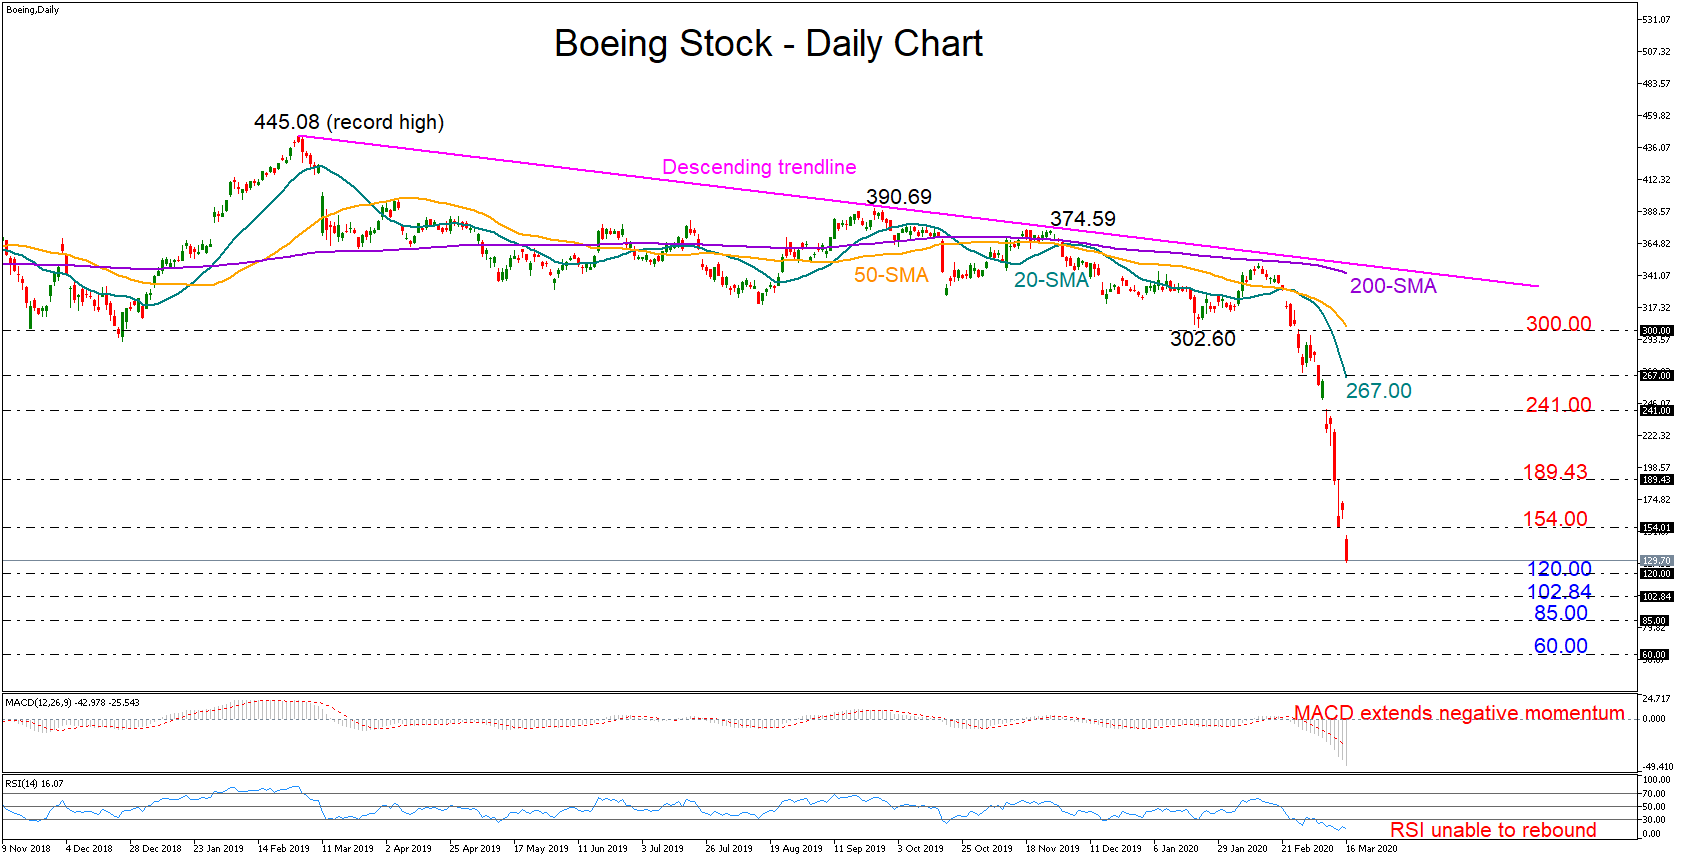
Boeing’s stock price has faced its worst decline in history in the past three weeks. Besides the virus critical situation, the airplane designer was lately downgraded by the S&P rating agency, with its stock plunging to a fresh 3 ½ -year low of 127.90 on Monday. With technical indicators framing a bearish picture for the short-term as all simple moving averages are slipping downwards at a time the RSI and the MACD show no sign of improvement, traders are now eagerly waiting to see [..]

post-image

Technical Analysis – Netflix stock loses ground near to 3-month low; bearish bias

Posted on March 17, 2020 at 10:06 am GMT

Netflix stock price plummeted to a new three-month low of 292 during yesterday’s trading session, retaining the bearish movement that broke the medium-term ascending trend line. Also, the price has been developing beneath the flatten 200-day simple moving average (SMA), suggesting the start of a negative trend. In technical oscillators, the MACD is strengthening its bearish momentum below the zero line, while the RSI and the Stochastics are moving towards oversold levels, pointing to another negative session. Should the stock price stretch below December’s low of 292, immediate support could come [..]

post-image

Technical Analysis – WTI oil futures cautiously bearish ahead of multi-year low

Posted on March 17, 2020 at 10:02 am GMT

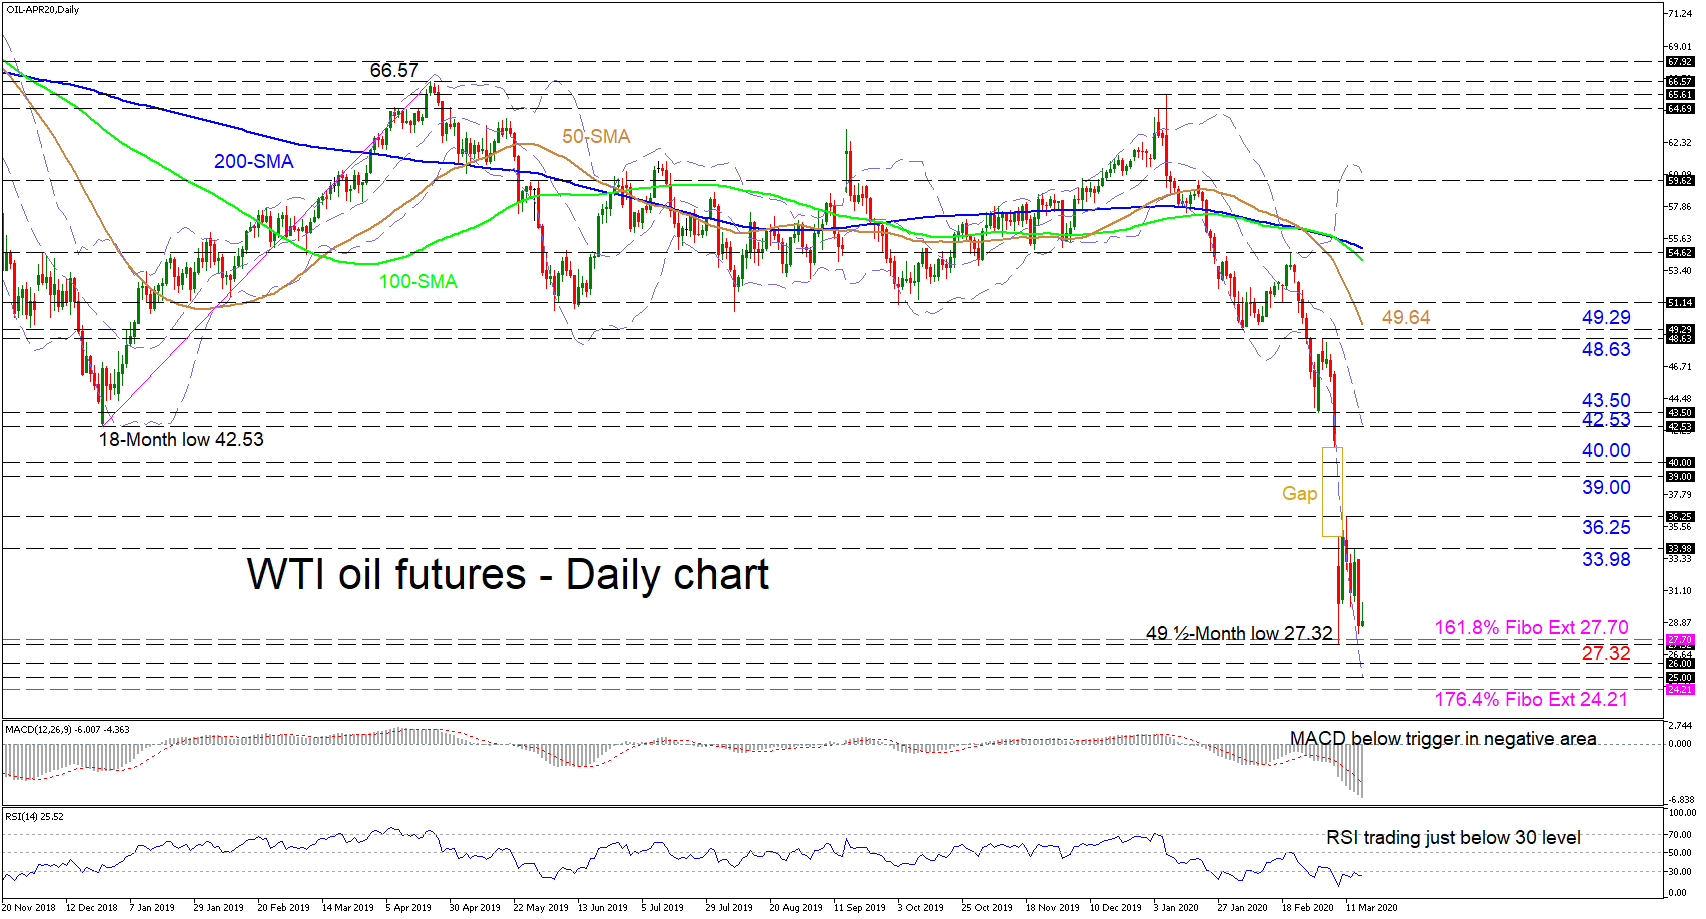
WTI oil futures continues to reflect signals of a negative market after breaking the 49.29 low and even plummeting past the 18-month trough of 42.53 from December 2016, which resulted in the commodity gapping towards a multi-year bottom of 27.32. The short-term oscillators maintain a negative picture with the MACD, in the negative zone, declining deep below its red trigger line, while the RSI hovers in the oversold territory, flirting with the 30 mark. Worth mentioning is the intact bearish [..]

post-image

Technical Analysis – US 500 index heavily negative after fiscal stimulus ideas; nears 2018 low

Posted on March 17, 2020 at 9:09 am GMT

The US 500 stock index (cash) crashed by another 11% on Tuesday as the US fiscal stimulus proposals seem to be spreading panic rather than reassuring investors. The index fell as low as 2,362, violating the 200-period simple moving average (SMA) on the weekly chart for the first time since 2011. Still, on the positive side it managed to halt the sell-off near the 2018 trough, keeping its long-term uptrend safe for now. On the daily chart, technical signals are not encouraging either. Although [..]

Technical Analysis – GBPUSD risks remain to the downside; reaches 5-month low of 1.22

Posted on March 17, 2020 at 7:38 am GMT

GBPUSD is approaching the five-month low of 1.2200 once again, continuing the steeper declines that started after the penetration of the downward sloping channel on March 12. The risk is still to the downside as the technical indicators are facing negative momentum the bearish areas. The RSI is flattening just below the 30 level, while the MACD oscillator is extending its movement beneath its trigger line, suggesting more losses in the near term. Should cable tumble below the strong 1.2200 psychological level, it could [..]

post-image

Technical Analysis – Copper futures plunge lower to a multi-year low

Posted on March 16, 2020 at 4:30 pm GMT

Copper futures plunged to a fourty-month low of 2.6204 today before buyers resurfaced. The correction in the price was also reflected in the bounce of the RSI on the 30 oversold mark and the recent turn up in the Stochastic blue %K line towards its red % D line just beneath the 20 level. That said, the MACD is declining below its red trigger line in the negative zone and the simple moving averages (SMAs) still display a negative picture [..]

post-image

Technical Analysis – EURGBP unlocks 6-month high; indicators look overbought

Posted on March 16, 2020 at 2:08 pm GMT

EURGBP recorded a stunning rally over the last month towards a six-month peak of 0.9132. The Ichimoku lines and the moving averages are following this bullish action, with the 40-day simple moving average (SMA) and the 100-day SMA posting a golden cross. According to the Relative Strength Index (RSI), the market may extend its movement to overbought levels as the index is standing above 70 mark. In addition, the MACD oscillator is still moving north above its red trigger and zero [..]

Risk Warning: Your capital is at risk. Leveraged products may not be suitable for everyone. Please consider our Risk Disclosure.