XM does not provide services to residents of the United States of America.

Technical Analysis

post-image

Technical Analysis – USDCAD slides but finds support at around 1.3410

Posted on January 30, 2024 at 2:50 pm GMT

USDCAD retreats but meets support at 1.3410 Both the daily oscillators paint a mixed picture For the picture to brighten, a break above 1.3535 may be needed USDCAD slid in the last few days after hitting resistance once again at around 1.3535. That said, the retreat stopped near the 1.3410 barrier, keeping the pair above the prior downtrend line drawn from the high of November 1. If more bulls are willing to jump into the action from near the 1.3410 [..]

post-image

Technical Analysis – AUDUSD challenges 50-SMA, crucial trendline in sight

Posted on January 30, 2024 at 2:35 pm GMT

AUDUSD slides towards 50-period SMA A violation could open the door for ascending trendline test Oscillators tilt to the bearish side   AUDUSD has been in a slow recovery since its January bottom of 0.6524, breaking above the downward sloping trendline drawn from December highs. In the near-term, the price reversed lower after failing to break above the Ichimoku cloud, but the 50-period simple moving average (SMA) has been acting as a strong floor. If the retreat extends below the [..]

post-image

Technical Analysis – Silver recovers but picture still cautiously negative

Posted on January 30, 2024 at 2:21 pm GMT

Silver prices bounce back after seven-week decline Momentum oscillators around their neutral levels Break either above 24.60 or below 21.90 would signal direction   Silver prices have risen over the last week, breaking above a downtrend line to recover a small chunk of the losses from the selloff that started in early December. That said, the structure of lower highs and lower lows is still in force and the market is also trading below its key moving averages, which suggests [..]

post-image

Technical Analysis – Amazon stock rallies to 21-month high

Posted on January 30, 2024 at 12:43 pm GMT

Amazon stock continues bullish structure Technical oscillators enter overbought regions Amazon shares recorded a stunning rally in Monday’s session, creating a new 21-month peak of 161.16. The stock has posted gains of more than 12% since the beginning of the year and the technical oscillators suggest that the market could rise even higher. The RSI is currently increasing positive momentum towards its overbought area, while the MACD is gaining momentum above its trigger and zero lines. Also, the stochastic oscillator (or stochastics) posted a bullish crossover within its %K and %D lines [..]

Technical Analysis – EURJPY starts a new bearish cycle

Posted on January 30, 2024 at 11:58 am GMT

EURJPY trims January’s gains within bullish channel Short-term risk skewed to the downside   EURJPY started a new bearish cycle within a short-term upward-sloping channel, pulling from a one-and-a-half month high of 161.85 to reach a low of 159.20 on Tuesday. Technically, the 78.6% Fibonacci retracement of the previous downleg halted January’s rally, with the 20- and 50-day exponential moving averages (EMAs) currently trying to prevent additional declines below the 159.00 mark. That said, the negative trajectory in the RSI and [..]

post-image

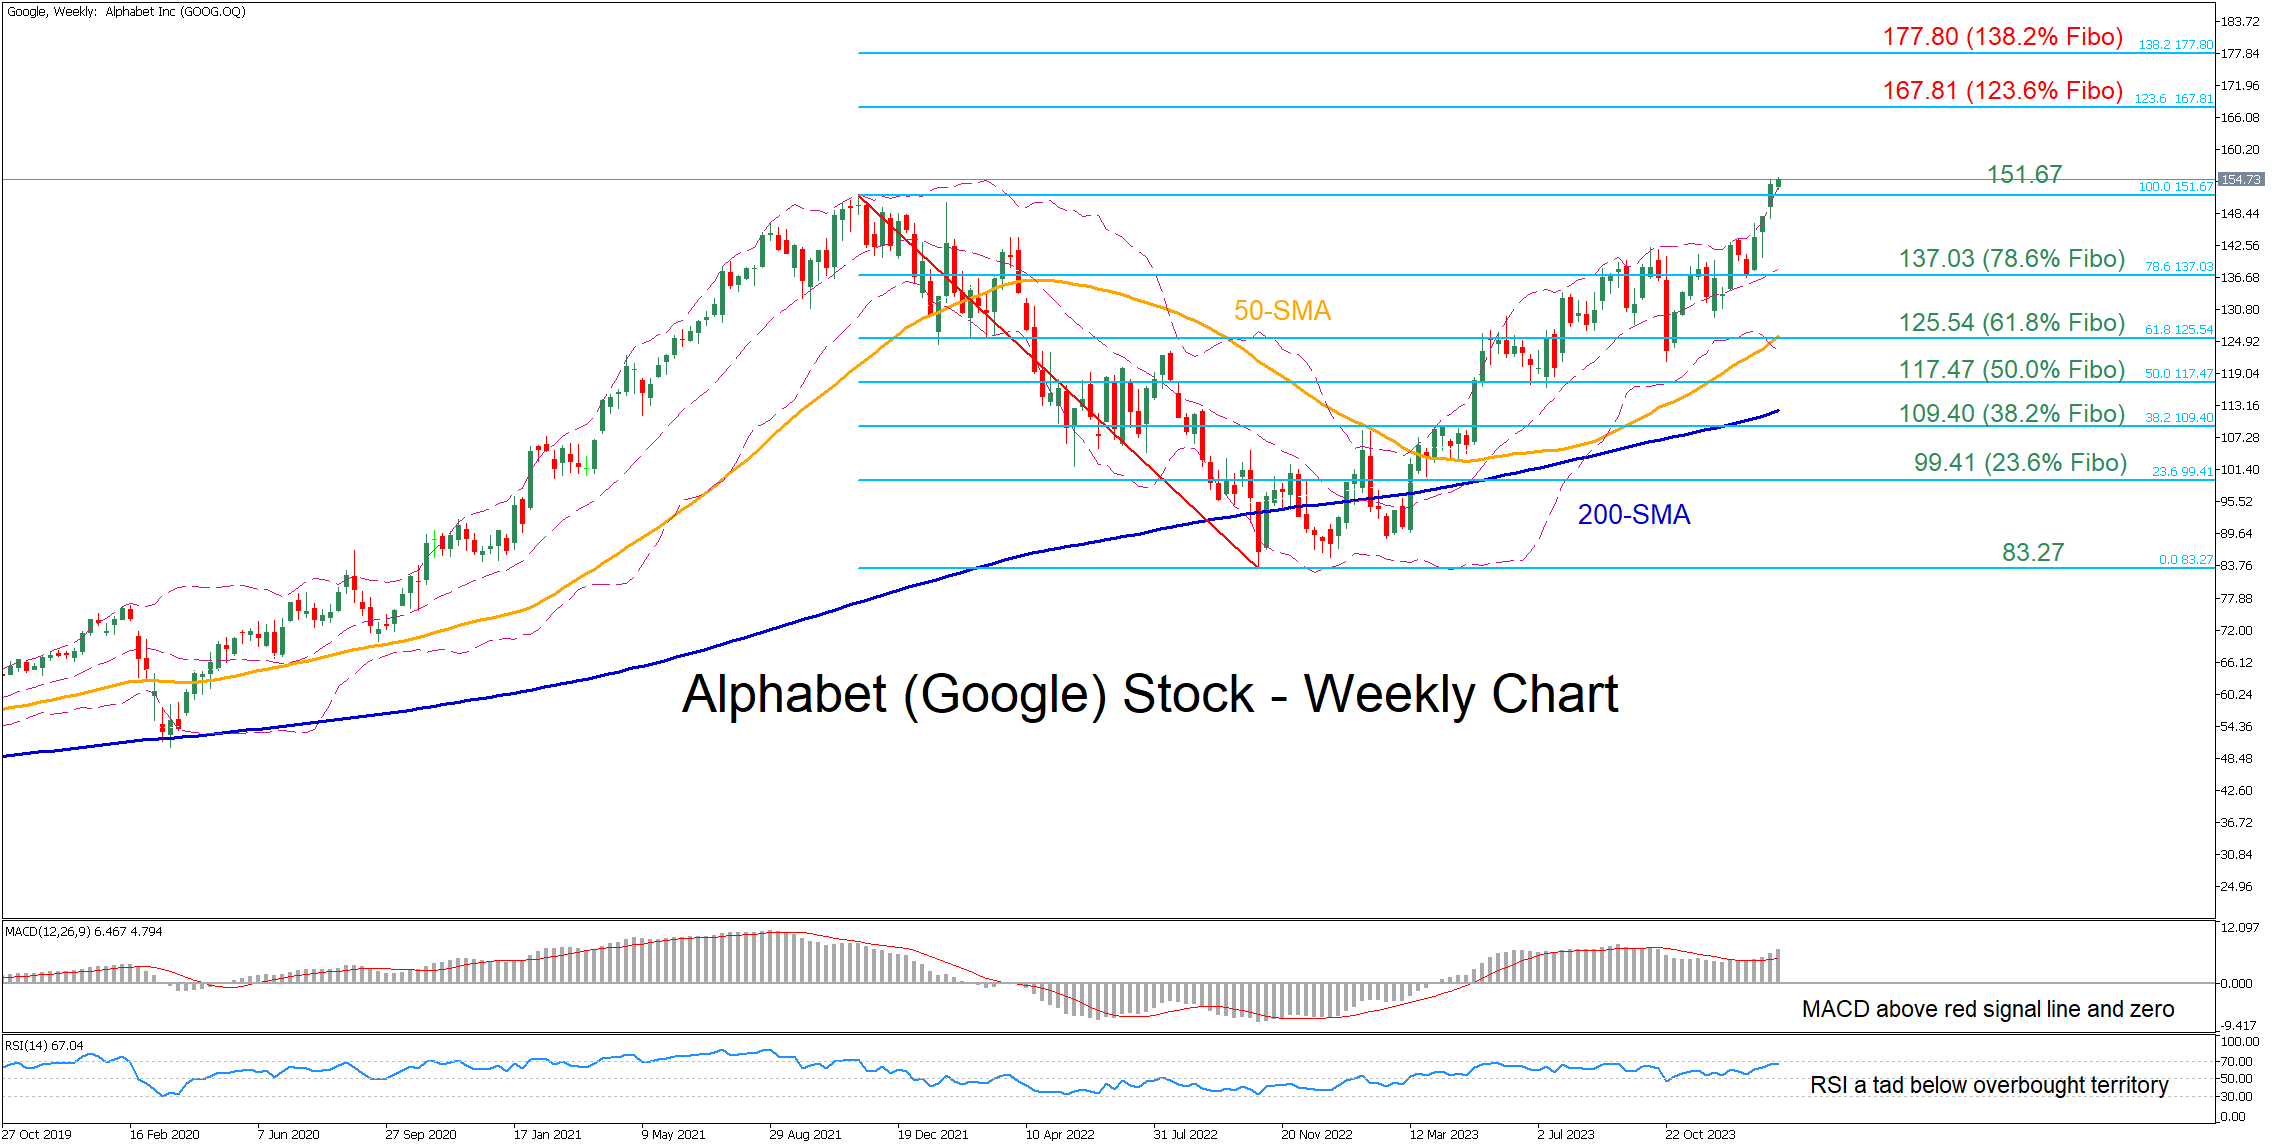
Technical Analysis – Alphabet storms to record highs ahead of earnings

Posted on January 30, 2024 at 11:22 am GMT

Alphabet shares surge to consecutive all-time highs Momentum indicators are approaching overbought zones This poses asymmetric risks for the upcoming earnings report   Alphabet’s stock has been in a steady uptrend since October 2022, which has accelerated in the past couple of months. Zooming in the short-term picture, the price has been posting consecutive record peaks in 2024, but the advance is starting to look overdone from a technical perspective. If the stock defies all odds and extends its rally [..]

post-image

Technical Analysis – EURGBP hits the lower bound of a broader range

Posted on January 30, 2024 at 10:15 am GMT

EURGBP slides but finds support at the lower end of a range A break below that support may turn the outlook bearish Both the MACD and the RSI detect downside momentum EURGBP entered a sliding mode on December 28, after hitting resistance slightly above 0.8700, the upper boundary of the broader sideways range that’s been containing most of the price action since the beginning of May 2023. That said, the slide was paused yesterday near the lower end of the [..]

post-image

Technical Analysis – US 500 index displays fresh all-time high

Posted on January 30, 2024 at 9:40 am GMT

US 500 index holds above 161.8% Fibonacci extension MACD and RSI in overbought territories The US 500 (cash) index experienced a fresh rally during Monday’s session, and today it posted a new all-time high of 4,833. The price surpassed the 161.8% Fibonacci extension level of the downward wave from 4,600 to 4,100 at 4,920, endorsing the aggressive buying interest. The momentum indicators are supportive of this upleg. The RSI is appearing positive above the 70 level, and the MACD oscillator is [..]

Technical Analysis – EURUSD slips further after the fall below 200-day SMA

Posted on January 30, 2024 at 7:09 am GMT

EURUSD touched 1.0800 but returned higher Price moves within bearish triangle MACD and RSI suggest negative bias EURUSD tumbled below the crucial 1.0845 restricted zone, generating concerns that the decline from the 200-day simple moving average (SMA) may continue. Also, the market declined slightly below the 1.0800 round number during Monday’s session, meeting the lower boundary of the bearish triangle but it returned quickly above the 1.0815 barrier. Prior to resuming their efforts, the bulls might attempt to close above the 200-day SMA at 1.0845. [..]

post-image

Technical Analysis – JP 225 stock index eyes 161.8% Fibo after pullback from 34-year high

Posted on January 29, 2024 at 2:19 pm GMT

Japan’s benchmark index attempts to regain positive footing 37,000 level is still in sight But bullish momentum may not be strong enough The Japan 225 stock market index (cash) edged up on Monday, heading towards the 161.8% Fibonacci extension of the June-October 2023 downtrend at 36,313. Overcoming this barrier is crucial to being able to have another go at reclaiming the 37,000 level after coming just shy of it last week when it briefly hit a 34-year high of 36,991. [..]

Risk Warning: Your capital is at risk. Leveraged products may not be suitable for everyone. Please consider our Risk Disclosure.