XM does not provide services to residents of the United States of America.

Technical Analysis

post-image

Technical Analysis – USDCAD flirts with 20-SMA, signaling some losses in near term
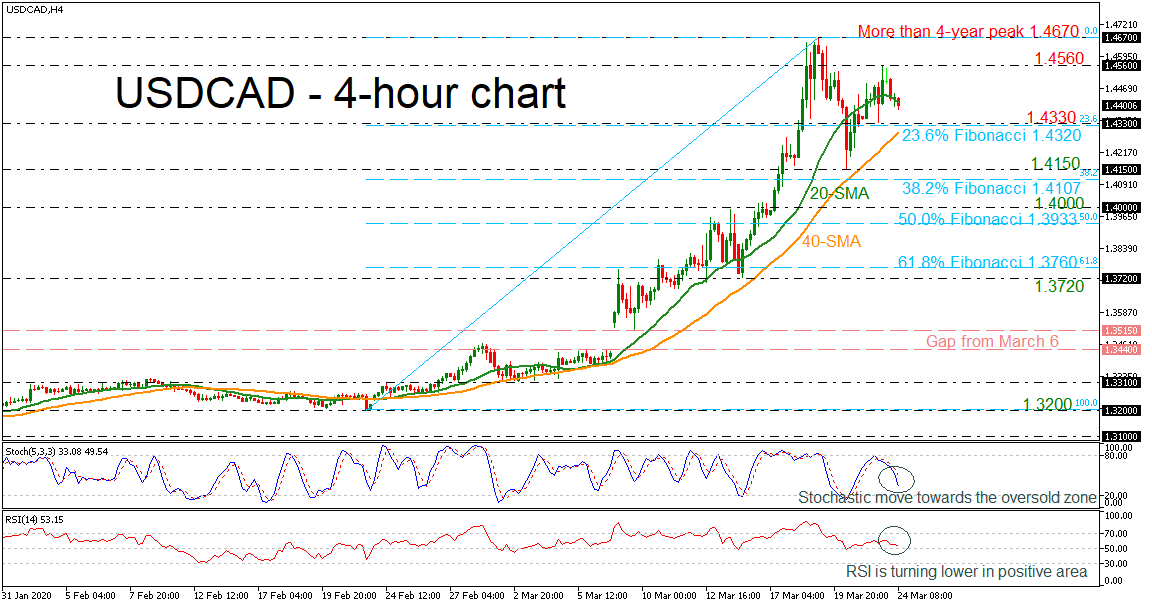
Posted on March 24, 2020 at 7:54 am GMT

USDCAD is on course to slip beneath the short-term 20-period simple moving average (SMA) creating a neutral mode after the sell-off from the more than four-year high of 1.4670. According to the momentum indicators, the stochastic oscillator is diving towards the oversold zone, while the RSI is turning lower in the positive area. Immediate support is being provided by the 23.6% Fibonacci retracement level of the up leg from 1.3200 to 1.4670, around 1.4320, which stands near the 1.4330 support [..]

post-image

Technical Analysis – USDJPY maintains positive outlook near multi-month highs

Posted on March 23, 2020 at 3:38 pm GMT

USDJPY pushes higher continuing a two-week uptrend which commenced on March 9 from the 101.17 multi year low. The move seems to be backed by positive momentum within the upward sloping Ichimoku lines, as well as the bullish crossover of the 100-period simple moving average (SMA) by the 50-period one. Furthermore, the short-term oscillators also reflect a strengthening picture. The rising RSI looks to reclaim its 70 mark, while a bullish crossover between the inclining stochastic lines, heads for the [..]

post-image

Technical Analysis – US 500 Index attempts to correct from 39-month low

Posted on March 23, 2020 at 1:48 pm GMT

US 500 index (Cash) gapped today underneath the inside swing low of 2,273 reaching a multi-year low of 2,183.95 before buyers surfaced, steering the price back up towards the 2,350 area, where the flat Ichimoku lines are located. The short-term oscillators, although negative, reflect some strengthening in positive momentum. The MACD, in the negative zone, is below its red trigger line but looks to be moving back above it. The RSI, in the bearish region, is rising towards its neutral [..]

post-image

Technical Analysis – Spain 35 index recovers somewhat in near term; remains near low levels

Posted on March 23, 2020 at 1:27 pm GMT

The Spain 35 cash index has come under selling pressure after the strong downfall from the 21-month peak of 10,102 and remaining well below the longer-term simple moving averages (SMAs). However, the price rebounded on the multi-year low of 5,804 enhancing the argument that the picture may not be entirely negative at the moment, giving some signals for a possible upside correction in the near term. Looking at momentum oscillators on the daily chart, they suggest a slightly bullish to [..]

post-image

Technical Analysis – AUSUSD slips marginally below 20-period SMA and 23.6% Fibonacci

Posted on March 23, 2020 at 10:28 am GMT

AUDUSD has been underperforming in the past two days, breaking back below the 23.6% Fibonacci retracement level of the down leg from 0.6685 to 0.5506 at 0.5783. When looking at the bigger picture, the pair has a clear downside trend and has been moving below the short-term simple moving averages (SMAs). Considering the momentum indicators, the RSI is lacking direction slightly below its neutral threshold of 50, suggesting that the market could keep consolidating in the near term. The MACD [..]

Technical Analysis – Gold finds some footing to keep the sell-off at bay

Posted on March 23, 2020 at 8:50 am GMT

Gold appears to have found some support around the November 2019 lows from 1,446 to 1,455 – pivoting from this region – and is currently capped by the 200-day simple moving average (SMA). Both the declining Tenkan-sen line and the MACD are continuing to back the drop, with the Tenkan-sen line completing a bearish crossover of the flattened blue Kijun-sen line and the continuing of the MACD to hold in the negative zone below its red trigger line. Moreover, the [..]

Technical Analysis – EURUSD re-activates bearish structure in short- and medium-term

Posted on March 23, 2020 at 8:43 am GMT

EURUSD re-activated its two-year old downtrend after forcefully clearing the 1.0777 floor last week to print fresh lows at 1.0635 on Monday. The price is currently pushing efforts to recoup some lost ground but the slight improvement in the RSI and the Stochastics, which are still well into the bearish area and near oversold terittory, is not convincing yet, keeping the short-term bias negative. The downside reversal in the 20-day simple moving average (SMA) that is ready to slip back [..]

post-image

Technical Analysis – USDJPY develops in upward sloping channel in short term

Posted on March 23, 2020 at 8:21 am GMT

USDJPY has been creating an upward sloping channel since the bounce off the more than three-year bottom on 101.15, achieved on March 9, in the 4-hour chart. Currently, the price is capped by the red Tenkan-sen line and finds support at the 20-period simple moving average (SMA), looking forward for a potential positive session. According to the technical indicators, the RSI is heading marginally up in the positive territory, after the downfall from the overbought zone. However, the MACD is falling beneath its [..]

post-image

Technical Analysis – Silver recoups some losses after the plunge to 11-year bottom

Posted on March 20, 2020 at 11:06 am GMT

Silver prices have gained little over the last couple of sessions, holding above the eleven-year trough of 11.60 that was posted earlier this week. However, the 50-day simple moving average (SMA) is in the process of creating a ‘death cross’ with the 200-day SMA, confirming the steep decline in the preceding days. Regarding the near-term technical viewpoint, the stochastic is pointing marginally up in the oversold territory after the bullish cross within its %K and %D lines. Also, the RSI is moving higher beneath the 30 level, indicating a possible [..]

post-image

Technical Analysis – EURGBP retraces from 11-year high, crawls below 23.6% Fibonacci

Posted on March 20, 2020 at 9:11 am GMT

EURGBP seems to be correcting from the 11-year high of 0.9498, after a phenomenal two-day aggressive rally sent the pair to historic highs not seen since 2009. The move down past the 0.9148 support is currently encountering some hindrance from the upward sloping red Tenkan-sen line slightly lower. The short-term oscillators reflect strengthening negative momentum for now. The MACD, in the positive region, although above its red trigger line, is weakening slightly, while the declining RSI has pushed out of [..]

Risk Warning: Your capital is at risk. Leveraged products may not be suitable for everyone. Please consider our Risk Disclosure.