XM does not provide services to residents of the United States of America.

Technical Analysis

post-image

Technical Analysis – USDJPY awaits nearby barrier to let the bulls out
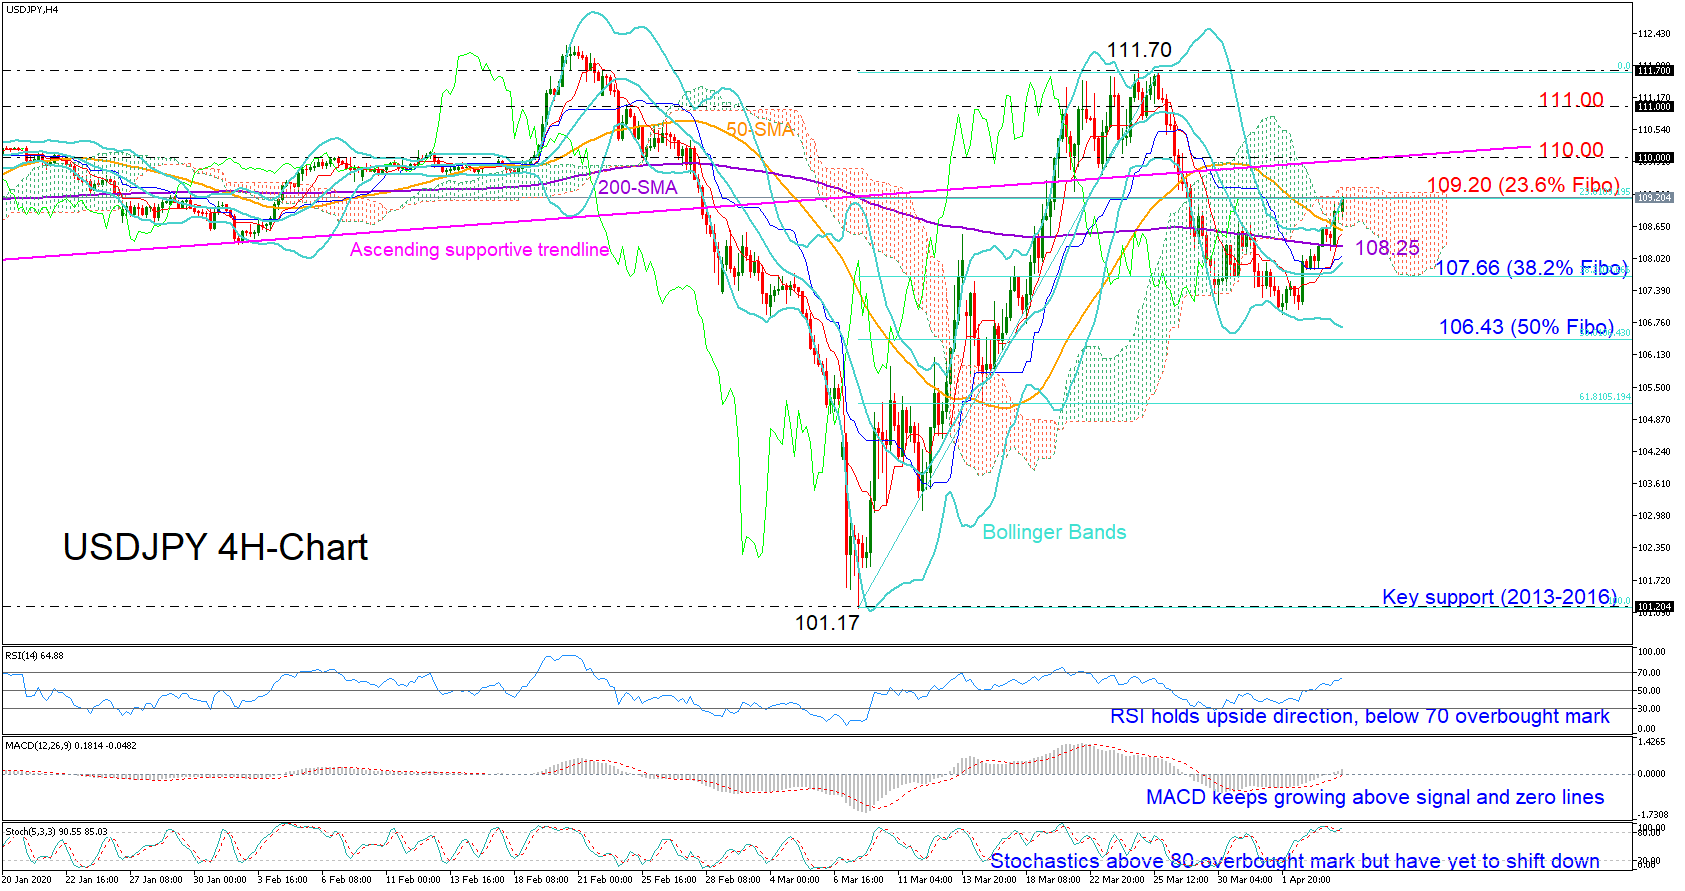
Posted on April 6, 2020 at 7:39 am GMT

USDJPY restored positive momentum on Monday and pierced the 109.00 level on the upside after stepping on the 200-period simple moving average (SMA) on the four-hour chart. While some stabilization cannot be ruled out since the 23.6% Fibonacci of the 101.17-111.70 upleg is in the neighborhood and the fast Stochastics are fluctuating in the overbought territory,  the price could soon resume upside direction as the MACD is growing in the positive area and the RSI keeps pointing up. Should the [..]

Technical Analysis – EURUSD in a rollercoaster mode last month; re-tests 1.0800

Posted on April 6, 2020 at 7:16 am GMT

EURUSD recovered its strong sell-off from the 13-month peak of 1.1495 to the three-year low of 1.0635, as it jumped close to the 61.8% Fibonacci retracement level of this downward move at 1.1170. Currently, the price is edging sharply lower again beneath the moving average lines and near the 1.0800 psychological mark. The market is lacking clear direction in the short-term as it is failing to create a clear trend. The MACD is ready for a bearish cross within its [..]

post-image

Technical Analysis – NZDUSD’s negative momentum gains new confidence

Posted on April 3, 2020 at 11:57 am GMT

NZDUSD is presently tackling the 0.5841 level, that being the 38.2% Fibonacci retracement of the down leg from 0.6447 to an 11-year low of 0.5468, after new-found negative sentiment sent the pair back into the Ichimoku cloud. Aiding this move down is the recent bearish crossover of the now declining Ichimoku lines. The short-term oscillators are providing extra backing towards a negative picture. The MACD has slipped below its zero and trigger lines, while the RSI is falling in the [..]

post-image

Technical Analysis – US 30 index sidelined in near term; strongly negative in medium term

Posted on April 3, 2020 at 10:35 am GMT

The US 30 cash index is being embraced by the 23.6% Fibonacci retracement level of the down leg from 29,582.61 to 18,145 at 20,851 and the 38.2% Fibonacci at 22,518 over the last days. The lack of direction is confirmed by the RSI indicator which is moving with weak momentum beneath the 50 level, while the MACD is edging sideways above the trigger line. Moreover, the 50- and 200-day simple moving averages (SMAs) are continuing to turn lower after the ‘death cross’ in the previous sessions. [..]

post-image

Technical Analysis – GBPUSD within a bullish rectangle but risks remain

Posted on April 3, 2020 at 8:06 am GMT

After the rebound off 35-year lows, GBPUSD has been trading quietly this week, congested within a narrow range of 1.2484 and 1.2300, where the former is the 50% Fibonacci of the 1.3513-1.1409 downleg. Technically, a sideways move following a rally is an indication that the pair is taking a breather before continuing higher. Yet, on the four-hour chart, the falling RSI which heads towards its 50 neutral mark backed by the declining MACD and the flattening red Tenkan-sen are currently not in favor of [..]

Technical Analysis – USDCAD optimistic after correction from 50-month peak

Posted on April 3, 2020 at 7:19 am GMT

USDCAD continues to find support from the mid-Bollinger band located at 1.4155, after a retracement from the multi-year top of 1.4667. Though price action has somewhat slowed, assisting this positive picture are the ascending simple moving averages (SMAs) and their intact bullish mode. Additionally, the short-term oscillators hold a positive bearing. The MACD, despite falling below its red trigger line, is still deep in the positive zone, while the RSI remained in the bullish section, hovering above the 50 level. [..]

Technical Analysis – WTI futures retain bearish picture in long term

Posted on April 3, 2020 at 7:12 am GMT

WTI futures look to be mostly bearish after a descent rally from the 65.61 resistance on January, driving the commodity down to a multi-year trough of 19.32. In the preceding days, the price reversed slightly higher, touching the 20-day simple moving average (SMA). The short-term oscillators reflect a rise in the positive momentum. The MACD, in the negative area, has moved above its trigger line and is approaching the zero line. Additionally, the stochastics, which are moving towards the overbought [..]

post-image

Technical Analysis – USDCHF’s appreciation finds some footing from supportive trend line

Posted on April 2, 2020 at 2:31 pm GMT

USDCHF appears to be breaking above the upper Bollinger band and the inside swing low of March 24 at 0.9717, after the climb from the 0.9500 trough was aided by the very short-term supportive trend line, just above the 0.9647 low. The short-term oscillators reflect a pickup in positive momentum as the RSI is improving above its neutral mark and the MACD, above its red trigger line, ascends over the zero level. Moreover, the stochastic oscillator has reclaimed the 80 [..]

post-image

Technical Analysis – Copper futures on sidelines move in ascending triangle

Posted on April 2, 2020 at 1:45 pm GMT

Copper futures with delivery in May have been trading within an ascending triangle over the last couple of weeks, with strong resistance at the 2.2345 barrier. The short-term moving average lines are flattening near the 38.2% Fibonacci retracement level of the negative move from 2.5268 to 1.9683 at 2.1815. Technically, the MACD, holding near the zero level, is heading sideways in the 4-hour chart while the RSI is turning marginally lower at the 50 level, trying to enter in the bearish area. These signals [..]

post-image

Technical Analysis – EURUSD slips near 1.0900; SMAs seem ready for bearish cross

Posted on April 2, 2020 at 9:35 am GMT

EURUSD is falling lower again near 1.0900, below the 20- and 40-period simple moving averages (SMAs) and the 38.2% Fibonacci retracement level of the down leg from 1.1495 to 1.0636 at 1.0962 over the last days. The pullback on the confronted 1.1150 level appeared to be a strong resistance for the bulls as the short-term trading is shifting bearish again. The stochastic oscillator is turning lower again, while the RSI is sliding below the 50 level and the MACD oscillator is extending its negative momentum below the zero line. [..]

Risk Warning: Your capital is at risk. Leveraged products may not be suitable for everyone. Please consider our Risk Disclosure.