XM does not provide services to residents of the United States of America.

Technical Analysis

post-image

Technical Analysis – USDCAD in descending move after pullback on more than 4-year peak

Posted on April 14, 2020 at 9:30 am GMT

USDCAD held onto losses for the third day in a row, dropping to a one-month low of 1.3855 on Monday. Currently, the pair has been developing below the 20- and 40-period simple moving averages (SMAs) and the falling tentative trend line since March 19. The RSI in the four-hour chart, is turning higher after the bounce off the oversold zone, while the stochastic oscillator is ready to form a bullish crossover with its %K and %D lines above the 20 line, increasing chances for [..]

Technical Analysis – EURJPY sideways market endures; sellers re-emerge

Posted on April 14, 2020 at 8:21 am GMT

EURJPY sellers seem to have resurfaced after the pair reversed down from the capping mid-Bollinger band. That said, the pair remains confined within a horizontal market of 122.86 – 116.11, as the clash between buyers and sellers continues to zigzag the price between these boundaries. Directional signals are also unclear as illustrated in the short-term oscillators. The MACD, in the negative region, has moved just above its red trigger line, while the RSI, hovers in the bearish zone, slipping slightly [..]

Technical Analysis – GBPUSD bulls return to the game; approach a tougher barrier

Posted on April 14, 2020 at 7:41 am GMT

GBPUSD terminated its range bound trading on Monday after the wall around the 1.2460 level, which is also the 50% Fibonacci of the downleg from 1.3513 to 1.1409, collapsed, giving the lead to the bulls. Subsequently, the price strengthened towards the 50-day moving average (SMA) which is currently under examination, with the momentum indicators suggesting that the battle at this point may be an easy one. The RSI is holding a positive slope above its 50-neutral mark, the red Tenkan-sen [..]

post-image

Technical Analysis – WTI futures bears face big challenge near 21.90; stochastic seems oversold

Posted on April 14, 2020 at 7:09 am GMT

WTI crude oil futures have been on the sidelines over the last couple of days as the 23.6% Fibonacci retracement level of the down leg from 54.70-19.25 at 27.56 seems to be a struggle for the bulls. The price could lose some more ground in the short-term, according to the RSI, as it is changing direction to the downside. However, the stochastics are warning over an oversold market, forming a bullish crossover within the %K and %D lines. A rebound [..]

post-image

Technical Analysis – GER 30 improves above 200-period MA

Posted on April 13, 2020 at 3:17 pm GMT

German 30 index’s (Cash) price appears to be gaining ground above the 200-period simple moving average (SMA), backed by the rising Ichimoku lines and the advancing 50- and 100-period SMAs. Also supporting this view, are the short-term oscillators, which display increasing positive momentum. The MACD, in the positive region, is strengthening above its red trigger line, while the RSI is rising in the overbought territory. If buyers continue to control the market, initial resistance could come from the 10,898 level, [..]

post-image

Technical Analysis – AUDUSD regains positive momentum as signals for advancement strengthen

Posted on April 13, 2020 at 1:24 pm GMT

AUDUSD looks to be picking up again, something also mirrored within the short-term oscillators. The pair plotted gains above the supportive trend line drawn from 0.5506, with the latest move from 0.5979 extending past the simple moving averages (SMAs). The MACD, although marginally below its red trigger line in the positive section, looks to move back above it, while the RSI rises back into overbought territory. Furthermore, the upward slopes of the 50- and 100-period SMAs and the approaching bullish [..]

post-image

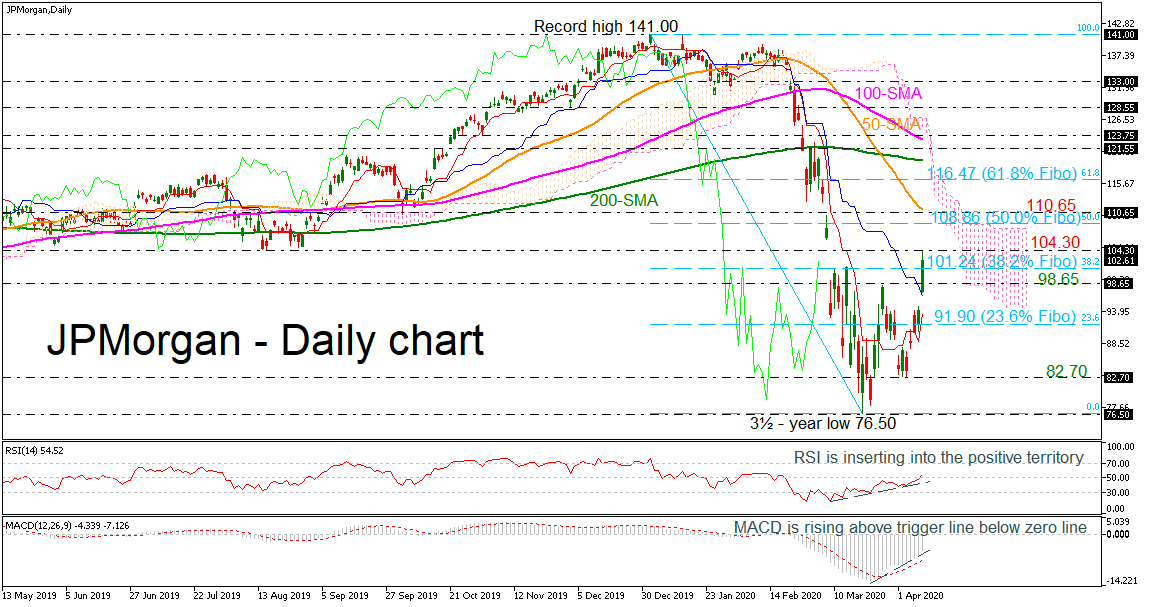
Technical Analysis – JPMorgan stock extends up in very short-term; indicators show upside tone

Posted on April 13, 2020 at 12:53 pm GMT

The JPMorgan stock price is finding resistance at the 104.30 barrier after the gap up that it posted on Thursday and the pullback on the three-and-a-half-year low of 76.50. Technically, the price is trading above the red Tenkan-sen and the blue Kijun-sen lines in the daily timeframe, but the simple moving averages (SMAs) are still pointing south. However, the RSI indicator is entering the positive path, while the MACD oscillator is rising above its trigger line, approaching the zero level. [..]

post-image

Technical Analysis – US 500 stock index holds in upward sloping channel after bounces off 39-month trough

Posted on April 13, 2020 at 10:06 am GMT

The US 500 cash index has been developing within an upward sloping channel, following the rebound on the 39-month trough, achieved on March 23. The price had a successful jump above the simple moving averages (SMAs) in the 4-hour chart, while the technical indicators are moving sideways, with the MACD crossing just below its trigger line and the RSI flattening above the 50 level. If price action jumps above the 50.0% Fibonacci level of the downward move from 3,396.64 – [..]

Technical Analysis – Gold gains backing for push to multi-year high

Posted on April 13, 2020 at 8:22 am GMT

Gold is presently attempting to breach the 1,690 resistance, after holding above the near-term uptrend line drawn from March 20. The recent positive price action off the ascending line appears to be reflected in a bullish crossover of the Kijun-sen line by the upward sloping Tenkan-sen line. The short-term oscillators continue to confirm the positive sentiment from the 1,566 level, with the MACD, in the positive region, increasing above its red trigger line while the RSI gradually advances in the [..]

Technical Analysis – EURUSD in confusion between broken trendlines

Posted on April 13, 2020 at 7:30 am GMT

EURUSD is in a state of confusion on the daily chart as the pair shows no clear direction, moving instead back and forth between two broken trendlines that seem to have regained some credibility over the past two weeks. Currently, the momentum indicators are reflecting a neutral-to-positive bias for the short-term as the RSI is pushing efforts to climb above its 50 neutral mark, while the stochastics and the MACD continue to strengthen northwards. A break above the 38.2% Fibonacci retracement of the latest [..]

Risk Warning: Your capital is at risk. Leveraged products may not be suitable for everyone. Please consider our Risk Disclosure.