XM does not provide services to residents of the United States of America.

Technical Analysis

post-image

Technical Analysis – EURCHF at one-month high but trend bearish overall

Posted on April 28, 2020 at 11:20 am GMT

EURCHF is making another attempt to close above the 50-day simple moving average (SMA) on Tuesday, sending the price to a four-week high of 1.6010. The strengthening RSI and the improving MACD are endorsing the move up. However, A bearish trend is well intact on the daily chart and only a decisive rally above the swing high of 1.0652 would violate the short-term negative direction, while a clear peak above 1.0700 could further strengthen the case of a trend reversal, [..]

post-image

Technical Analysis – Are WTI futures ready for a minor recovery?

Posted on April 28, 2020 at 10:33 am GMT

WTI crude oil futures have come under renewed selling pressure, falling back below the 38.2% Fibonacci retracement level of the downward wave from 36.22 to 6.75 at 18.03. The technical indicators, though, are sending some bullish signals, suggesting that the softness in the market may pause. The RSI has reversed higher near oversold levels, slightly above 30 indicating that the market could weaken its bearish structure a little bit in the short-term. Stochastics are still in oversold territory, posting a [..]

Technical Analysis – GBPUSD upside risks in place but a potential reversal pattern also in focus

Posted on April 28, 2020 at 8:33 am GMT

GBPUSD is finding support around the 50-period simple moving average (SMA) on the four-hour chart and is pushing efforts to regain momentum within the 1.2400 area after a quiet start to the day. Additional gains cannot be ruled out in the short-term as the RSI is trying to break its recent range, while the MACD is strengthening at a gradual pace in the positive area. However, in terms of trend, a potential head and shoulders pattern seems to be in progress, sending a negative warning of [..]

post-image

Technical Analysis – US 500 stock index’s positive picture stalls; edges sideways

Posted on April 28, 2020 at 6:54 am GMT

US 500 index (Cash) is experiencing some limitations around the 2,893 resistance, where the upper Bollinger band presently resides. The smoothed appearance in price action over the last two weeks is also demonstrated in the flattening of the 200-period simple moving average (SMA), as the price holds between 2,893 and 2,708. The short-term oscillators also reflect the stall in price and suggest a weakened state of directional momentum. The MACD, in the positive zone, is flattening slightly above its red [..]

Technical Analysis – EURJPY still decreasing near 3-year low

Posted on April 28, 2020 at 6:49 am GMT

EURJPY flirted with a fresh three-year low of 115.53 on Friday, before returning slightly higher above 116.00 in the very short-term. In the longer timeframe, the price is moving lower over the last three months, remaining well below the short-term simple moving averages (SMAs). Also, the MACD oscillator is extending its downside movement below the zero and trigger lines, while the RSI is flattening in negative territory. If prices continue to head lower, immediate support is coming from the 115.53 [..]

post-image

Technical Analysis – Tesla stock builds base above SMAs; resumes positive picture

Posted on April 27, 2020 at 1:05 pm GMT

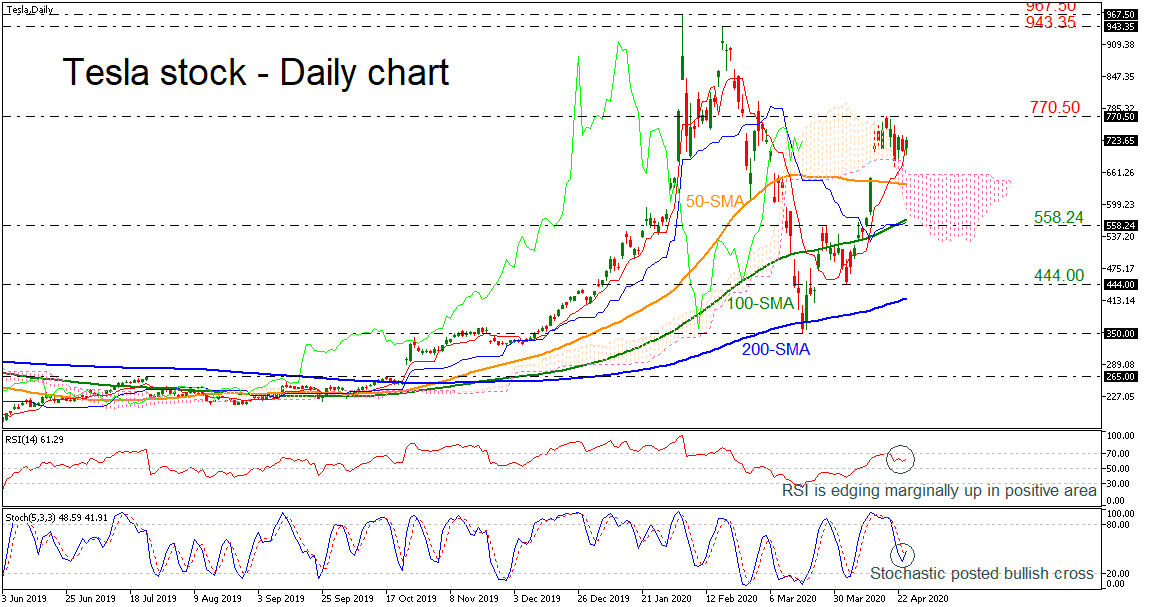
Tesla stock price has advanced considerably above the simple moving averages (SMAs) and the Ichimoku cloud in the daily timeframe, suggesting a continuation of the upside tendency. The technical picture supports that this move is likely to continue in the short-term. The RSI is pointing slightly up above the 50 level, while the stochastic completed a bullish crossover within its %K and %D lines. In the wake of more positive pressures, the market could meet resistance at the 770.50 barrier, [..]

post-image

Technical Analysis – AUDUSD set to bring uptrend back to life; overbought signals strengthen

Posted on April 27, 2020 at 10:14 am GMT

AUDUSD is set to put its positive structure from the 0.5500 bottom back into play on the four-hour chart after ticking above its previous high of 0.6443 on Monday. Yet, with the RSI and the Stochastics losing steam in the overbought area, downside corrections cannot be ruled out. In this case, the red Tenkan-sen line at 0.6400 could add some support as it did recently. Should sellers persist, the price could next retest the 50-period simple moving average (SMA), currently flat at [..]

post-image

Technical Analysis – EURUSD rebounds on minor ascending line; lacks direction

Posted on April 27, 2020 at 9:33 am GMT

EURUSD has been trading within a triangle pattern over the last seven weeks after it hit a 13-month peak slightly below the 1.1500 handle. The price is currently touching the upper boundary of the formation, while not far above the 20-day simple moving average (SMA) is also located. Looking at the technical indicators, the MACD although below its red trigger line, has eased negative momentum, while the RSI also looks to be improving within the bearish area, approaching the threshold of 50. Both are moving towards their [..]

post-image

Technical Analysis – GBPUSD undecided, mirroring loss in directional momentum  

Posted on April 27, 2020 at 9:25 am GMT

GBPUSD although having pushed back above all simple moving averages (SMAs), appears rather flat between 1.2246 and the 1.2516 level, that being the 61.8% Fibonacci retracement of the down leg from the 1.3200 high to the 35-year low of 1.1410. The technical oscillators reflect a shortcoming in directional momentum by painting an unclear picture, with the SMAs tilting slightly negative and the pair finding difficulty to exhibit further improvements. The MACD is just below zero but above its red trigger [..]

Technical Analysis – USDJPY under bearish control after closing below triangle; 106.90 support eyed

Posted on April 27, 2020 at 7:34 am GMT

USDJPY closed clearly below the symmetrical triangle on Monday on the four-hour chart, letting the bears take control. The momentum indicators are currently backing the bearish mode as the RSI, the Stochastics, and the MACD are all decelerating, shifting the focus to the downside and particularly to the 106.90 key support level which provided a strong footing for the market this month. In the negative scenario, should the 106.90 barrier prove easy to get through, re-activating the downward move from the [..]

Risk Warning: Your capital is at risk. Leveraged products may not be suitable for everyone. Please consider our Risk Disclosure.