XM does not provide services to residents of the United States of America.

Technical Analysis

post-image

Technical Analysis – USDJPY acquires some negative fuel; upside corrections dwindle
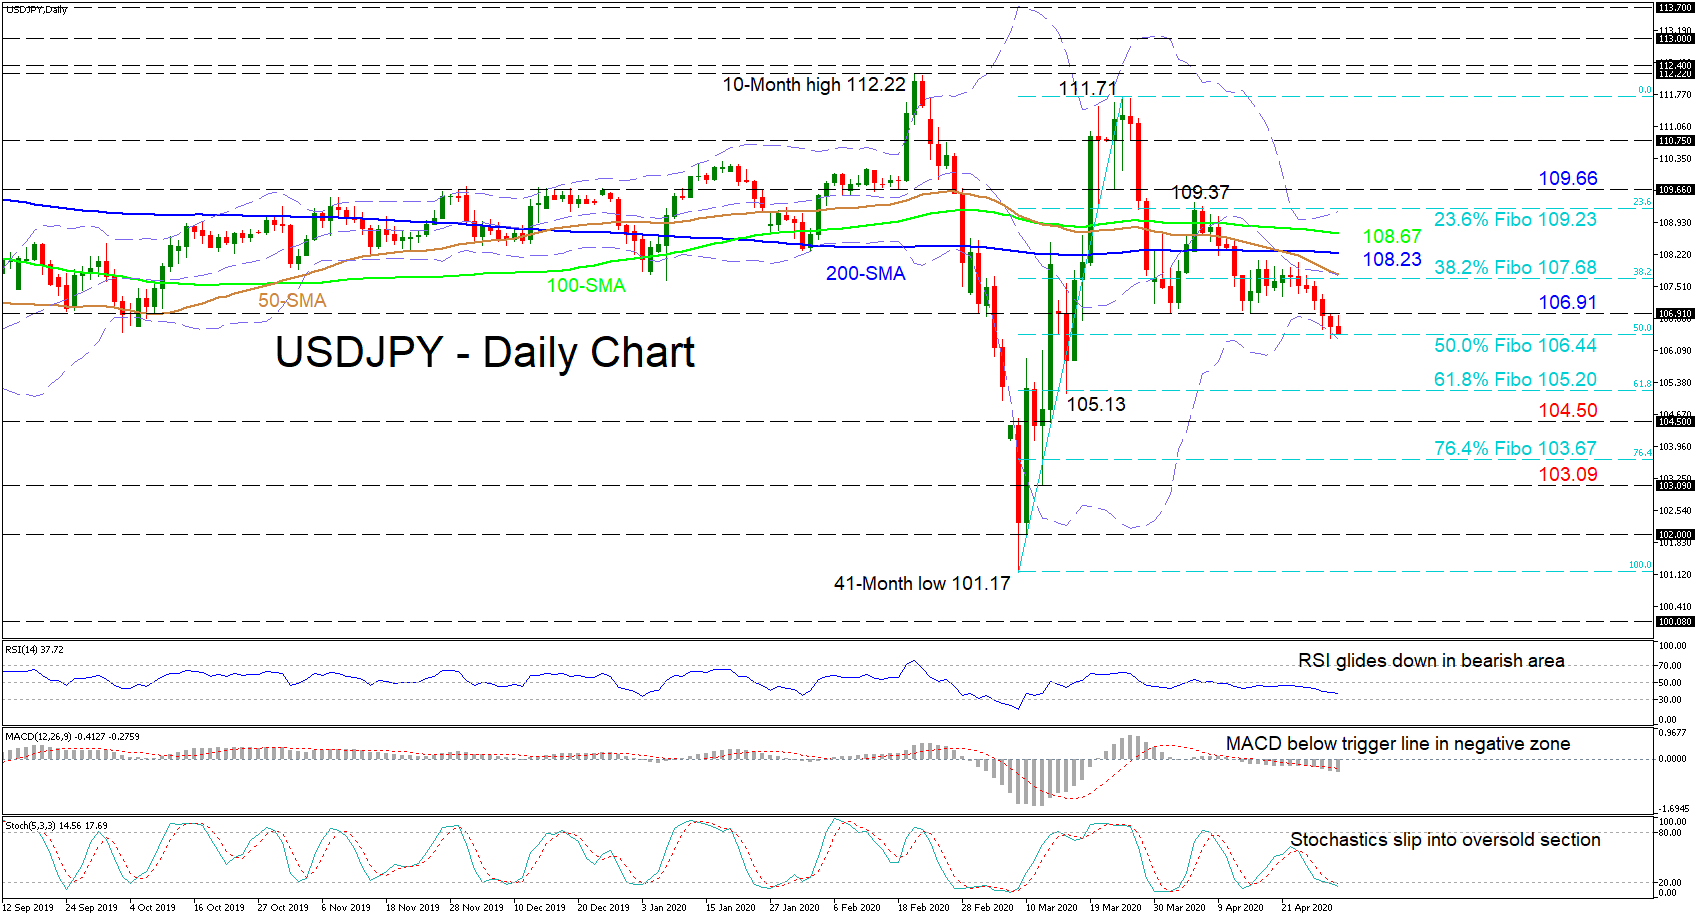
Posted on April 30, 2020 at 7:00 am GMT

USDJPY has lost extra ground past the lows of 106.91 after having failed to overcome the mid-Bollinger band last week. Presently the price is resting at the 106.44 level, that being the 50.0% Fibonacci retracement of the up leg from the 41-month low of 101.17 to the 111.71 high and where the lower Bollinger band is located. The short-term oscillators appear to be confirming the new-found negative move within the price as does the downward sloping 50-day simple moving average [..]

Technical Analysis – USDCAD flirts with sharper selling interest; neutral in near term

Posted on April 30, 2020 at 6:37 am GMT

USDCAD came close to ending the day near the 1.3850 support level, near the lower surface of the Ichimoku cloud, posting a strong sell-off session. This movement drove the simple moving averages (SMAs) to complete a bearish crossover in the short-term, and the technical indicators to head sharply lower. The stochastic is hovering in the oversold zone, while the RSI indicator is diving in the negative territory. A stronger downside movement could see immediate support of the 50.0% Fibonacci retracement [..]

Chinese manufacturing PMI could stay in the expansion area – Forex News Preview

Posted on April 29, 2020 at 2:27 pm GMT

The Chinese National Bureau of Statistics (NBS) will publish April’s manufacturing PMI survey on Thursday at 01:00 GMT and analysts expect a tiny pullback after last month’s incredible rebound that drove the index to pre-outbreak levels. While the slowdown in the data may not downgrade hopes of further improvement in the second quarter, the limited actions taken by the country combined with suffering international markets may keep the country’s overall economic outlook cloudy for now. China’s manufacturing PMI may slow [..]

post-image

Technical Analysis – Twitter stock retains positive bias but indicators are weakening  

Posted on April 29, 2020 at 12:22 pm GMT

Twitter stock price has been holding in an upward sloping channel after the bounce off the 28-month low of 20.00. In the short-term, the upside momentum is confirmed by the simple moving averages (SMAs), however, the technical indicators are losing momentum. The RSI is moving lower towards the neutral level, while the MACD is heading down in the positive territory. Should the stock stretch south, immediate support is coming from the 100-period SMA, which stands near the 38.2% Fibonacci retracement [..]

post-image

Technical Analysis – AUDJPY turns neutral as recovery continues

Posted on April 29, 2020 at 10:18 am GMT

AUDJPY continues to heal its wounds, posting higher highs and higher lows on the daily chart ever since it crashed to the 11-year low of 59.85 in mid-March. Attesting to the improving sentiment, the pair has crossed back above its 50-day simple moving average (SMA). Put together, these suggest the outlook has improved to neutral, from negative previously. Short-term oscillators are mixed, not painting a clear picture about the immediate term. The RSI is in positive territory but has flattened [..]

post-image

Technical Analysis – EURGBP in a sideways tone; still bearish in medium-term

Posted on April 29, 2020 at 8:42 am GMT

EURGBP has been moving sideways since the soft rebound on the 1-month low of 0.8680 on April 14, unable to fully recover losses made earlier in March. In the short-term, the market could maintain consolidation if the RSI keeps moving around 50 and the red Tenkan-sen line, as well as the blue Kijun-sen line, hold flat. Regarding the trend, this is likely to remain on the downside in the near-term as the 20-period simple moving average (SMA) continues to lose strength below the flat [..]

Technical Analysis – NZDUSD pushes above trendline but needs to face another key barrier

Posted on April 29, 2020 at 7:11 am GMT

NZDUSD picked up speed to break above the strong descending trendline and the Ichimoku cloud but it remains to be seen whether the price can finish the day on top of these barriers. Both the MACD and the RSI are somewhat optimistic that positive momentum could hold as the former has climbed above its 50 neutral mark, though marginally, and has yet to overcome its previous high, while the latter has slightly surpassed its zero and signal lines. That said, whether the price [..]

post-image

Technical Analysis – Gold consolidates below multi-year top

Posted on April 29, 2020 at 6:37 am GMT

Gold’s recent footing on the 100-period simple moving average (SMA) has kept the precious metal above the Ichimoku cloud and has returned it slightly above the 50-period SMA. Yet, the commodity’s two-week sideways move endures, unable to break out of the 1,739 and 1,660 boundaries. Further displaying the creeping horizontal mode are the unclear signals from the Ichimoku lines in the 4-hour chart. Looking to the short-term oscillators, they too paint a picture of evaporated directional momentum. The MACD is [..]

Technical Analysis – EURUSD neutral in short-term but still bearish in medium-term

Posted on April 29, 2020 at 6:29 am GMT

EURUSD has been trading within a symmetrical triangle formation since March 20, with a break outside it likely to determine the next trend direction. Moreover, the price rebounded after it found support near the uptrend line and the 1.0730 support, enhancing the argument that the picture may not be entirely negative at the moment in the very short-term. Technically, the price surpassed the 20- and 40-period simple moving averages (SMAs), entering the Ichimoku cloud. The stochastic oscillator is heading north [..]

post-image

Technical Analysis – Apple stock reverses up but 61.8% Fibo acts as strong resistance

Posted on April 28, 2020 at 1:28 pm GMT

Apple stock price has been in a retracement movement of the latest large fall from the record high of 327 to the 212 support. The price found strong resistance at the 61.8% Fibonacci mark of the aforementioned down leg at 283 and near the 100-day simple moving average (SMA). The MACD is currently increasing positive momentum above the zero and trigger lines, while the stochastics indicate a stronger bullish move as they approaching the overbought zone. An advance above the [..]

Risk Warning: Your capital is at risk. Leveraged products may not be suitable for everyone. Please consider our Risk Disclosure.