XM does not provide services to residents of the United States of America.

Technical Analysis

post-image

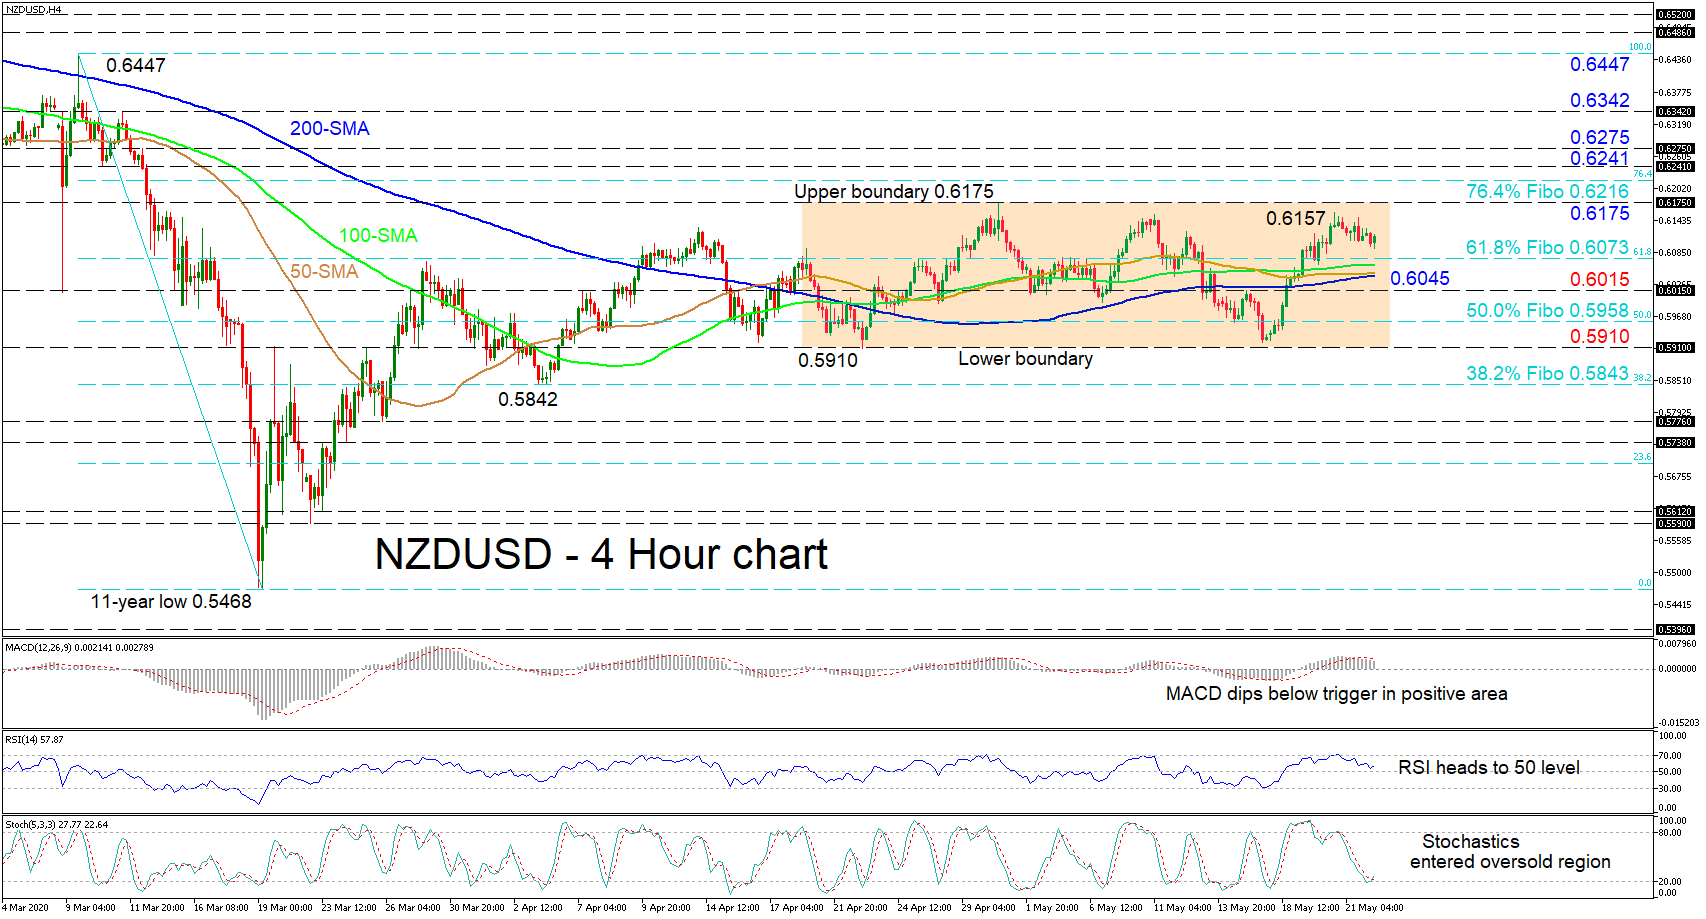
Technical Analysis – NZDUSD dwindles ahead of ceiling of directionless market

Posted on May 22, 2020 at 6:40 am GMT

NZDUSD appears to be fading from the vicinity of the upper boundary of the range of 0.6175 towards the 0.6073 level, that being the 61.8% Fibonacci retracement of the down leg from 0.6447 to the 11-year low of 0.5468, and the converged simple moving averages (SMAs) beneath. The short-term oscillators display the weakening in positive momentum. Yet, a pickup in bullish momentum cannot be ruled out for now, as the RSI in the positive area has turned back up ahead [..]

post-image

Technical Analysis – UK 100 index retests mid-Bollinger band; holds in ascending channel

Posted on May 21, 2020 at 2:12 pm GMT

The UK 100 index (Cash) looks to be mostly neutral in the very short-term after an ascent from the March 30 low of 5,294. The short-term oscillators reflect a stall in the positive momentum. The MACD is flattening in the positive area, while the stochastics, which are currently dropping lower are suggesting an overbought market. If sellers manage to close decisively below the 20-period simple moving average (SMA), the 5,915 support, which overlaps with the 40-period SMA and the lower [..]

post-image

Technical Analysis – Facebook leaves virus sell-off behind; hits fresh record highs

Posted on May 21, 2020 at 1:33 pm GMT

Facebook stock opened at fresh record highs on Wednesday and ran as high as 231.24, successfully recovering February’s virus-led downtrend that bottomed at a 14-month low in mid-March. The short-term bias is now viewed as cautiously positive as the price has pierced the upper Bollinger band, while the RSI has entered the overbought territory, both suggesting that room for improvement may be limited. Another leg up could stall somewhere between the 240.00 and 250.00 psychological marks. On the other hand, a downside [..]

post-image

Technical Analysis – EURUSD dives below 1.1000 key level

Posted on May 21, 2020 at 9:48 am GMT

EURUSD has gained some momentum, flirting with the three-week high of 1.1000 in the previous sessions, before dropping slightly lower. The technical indicators appear weak, as the MACD is flattening near its trigger line in the positive area and the RSI keeps moving marginally below the overbought region. The 20-period simple moving average (SMA) currently at 1.0925 could be a trigger point for steeper bearish action if the pair manages to break the red Tenkan-sen line. Lower, support could run [..]

post-image

Technical Analysis – EURJPY tackles 118.20 mark after lunging above 200-MA

Posted on May 21, 2020 at 7:40 am GMT

EURJPY’s latest aggressive run recently paused way above the 200-period simple moving average (SMA) at 118.20 after price action achieved footholds from the 115.32 level, on the Ichimoku cloud’s lower band and the 50-period SMA. The pair is in the process of pushing above this point, something also reflected in the now climbing Ichimoku lines. The MACD, deep in the positive region, is barely below its red trigger line looking to move back above it, while the RSI hovers bullishly [..]

Technical Analysis – AUDUSD keeps upside risks in play above 0.6400

Posted on May 21, 2020 at 7:33 am GMT

AUDUSD continues to send bullish signals in the daily timeframe as the price further enhanced its two-month old uptrend after stepping on the 0.6400 level and printing another higher high at 0.6615 on Wednesday. In the short-term, some weakness cannot be ruled out as the price is hovering around the upper Bollinger band and the RSI seems to be losing steam towards its 50 neutral mark. That said, any retracement would not be a big worry unless the market closes clearly below [..]

Technical Analysis – WTI futures creates new 10-week high with SMAs crossing above

Posted on May 21, 2020 at 6:55 am GMT

WTI crude oil futures are continuing a sharp bullish tendency after the rebound on the multi-year low of 6.75. The bullish crossover within the 20- and 40-day simple moving averages (SMAs) is approving this sentiment in the near term, while the price is ready to recoup the negative gap that posted on March 9. The technical indicators are located in the bullish area, with the MACD stretching further above its red signal line and the RSI moving towards the 70 [..]

post-image

Technical Analysis – US 100 index dreams of February’s record highs as rally continues

Posted on May 20, 2020 at 3:12 pm GMT

The US 100 stock index (cash) has almost recovered from the covid-19 injury, comfortably recouping the lost ground within the 9,000 territory this week and further deviating above its simple moving averages (SMAs). According to the strengthening RSI and the rising Stochastics, there is more bullish fuel in store, which could drive the price towards its record-high of 9,750 registered in February. For that to happen, though, the 9,460 resistance needs to give way first, while in case the market [..]

post-image

Technical Analysis – GBPJPY pulls back from falling trend line; slips below 132.00

Posted on May 20, 2020 at 1:22 pm GMT

GBPJPY pulled back off the descending trend line which has been holding over the last six weeks despite the upside break at the end of April, diving beneath the 132.00 psychological mark. According to the RSI, the market could maintain positive momentum in the short-term as the indicator is positively sloped above its neutral threshold of 50, the fast Stochastics suggest that some weakness is possible while the MACD is also flattening in the bullish region. Heading southwards, the price could attempt to slip below [..]

post-image

Technical Analysis – Gold continues the upside rally above SMAs

Posted on May 20, 2020 at 9:21 am GMT

Gold prices are moving towards the latest high – being the seven-and-a-half-year high of 1,765 – continuing the upside move after the bounce off the 1,725 support level. The price holds above the mid-Bollinger band and the RSI keeps rising above the 50 level. Also, the MACD oscillator is trying to create a bullish cross with its trigger line in the positive area, suggesting more gains in the very short-term. If the price continues the upside tendency, it could hit [..]

Risk Warning: Your capital is at risk. Leveraged products may not be suitable for everyone. Please consider our Risk Disclosure.