XM does not provide services to residents of the United States of America.

Technical Analysis

post-image

Technical Analysis – AUDUSD still bullish; encounters upside tensions

Posted on June 1, 2020 at 11:21 am GMT

AUDUSD today overcame the 0.6684 tough resistance from March 9, producing a nearly four-month high of 0.6772 and pushing the medium-term timeframe back into neutral territory. Although the price appears to have stalled ahead of the 0.6777 high from January 29, the Ichimoku lines retain their positive tone while the rising simple moving averages (SMAs) feed the bigger positive picture. The short-term oscillators at the moment display conflicting signals in directional momentum. Taking a glimpse at the RSI, it has [..]

post-image

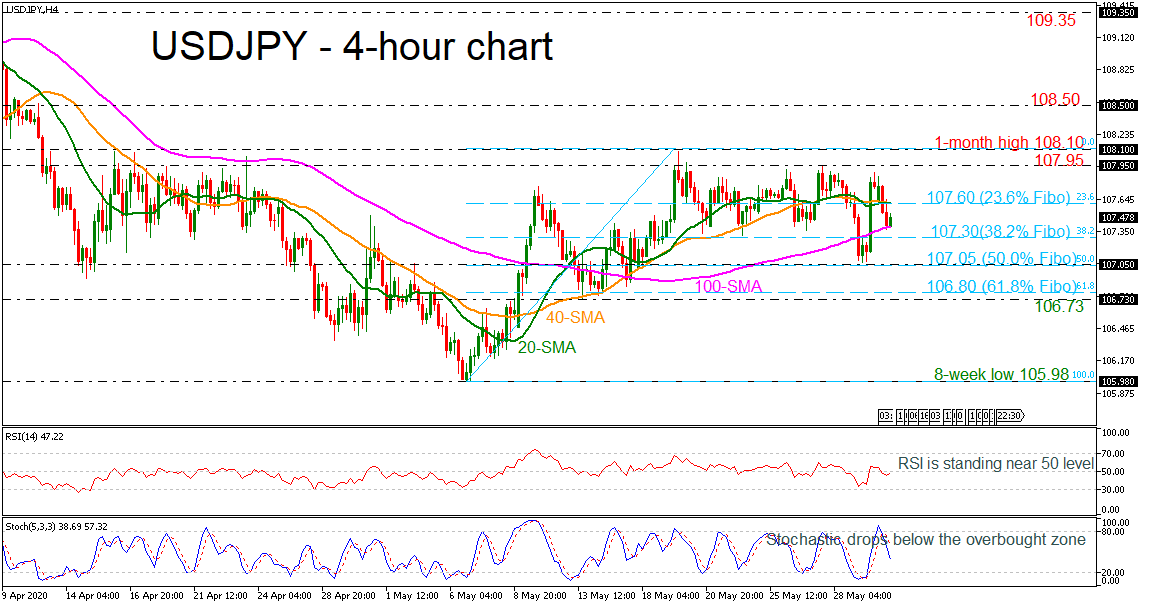
Technical Analysis – USDJPY retreats near 100-period SMA; neutral picture

Posted on June 1, 2020 at 10:00 am GMT

USDJPY has reversed back down after finding resistance at slightly below the 108.00 handle. The momentum indicators are pointing to a neutral to negative bias in the short term with the RSI just below 50 and the stochastic oscillator deep below the overbought area. Further losses below the 100-period SMA should see the 38.2% Fibonacci retracement level of the upward wave from 105.98 to 108.10 at 107.30. A drop below this area would reinforce the bearish structure in the short-term [..]

Technical Analysis – Gold’s positive signals grow, rekindling ascent

Posted on June 1, 2020 at 7:29 am GMT

Gold is nearing the upper Bollinger band that is currently situated at the swing high of 1,754. This occurred after buyers took the upper hand around 1,692 – that being the 23.6% Fibonacci retracement of the up leg from 1,455.17 to the 91-month high of 1,765.03. Further aiding a bullish picture are the positively charged simple moving averages (SMAs) and the increased gradient of the 50-day SMA. Additionally, the short-term oscillators reflect some strengthening in positive momentum. The MACD in [..]

Technical Analysis – EURUSD stretches bullish run near 2-month high

Posted on June 1, 2020 at 7:20 am GMT

EURUSD has been in a steep rally over the last four days, creating a new two-month peak around the 1.1145 resistance level. The price rebounded on the bullish crossover within the 20- and 40-day simple moving averages (SMAs), exiting from the short-term consolidation area and surpassing the flat 200-day SMA. Looking at the technical indicators, the MACD oscillator is climbing above the trigger and zero lines with strong momentum, while the RSI is heading towards the overbought levels, suggesting a [..]

post-image

Technical Analysis – US 30 index retains a positive outlook above 22,788

Posted on May 29, 2020 at 12:03 pm GMT

US 30 Index’s (Cash) bullish tone is intact with the price currently resting above the 25,219 level, that being the 61.8% Fibonacci retracement of the down leg from the all-time high of 29,582.61 to the 40½-month low of 18,170. The price is sponsoring gains trading above the Ichimoku cloud and the supportive trend line. Additionally, the bullish Ichimoku lines and the rising simple moving averages (SMAs) further endorse an improving picture. Glancing at the short-term oscillators, they display the recent [..]

post-image

Technical Analysis – EURGBP skyrockets to new 2-month high

Posted on May 29, 2020 at 10:44 am GMT

EURGBP surged towards a fresh two-month high of 0.9055 earlier today after picking up momentum above the 0.9000 resistance. Meanwhile, in technical indicators, the RSI is hovering in overbought zone, while the blue %K line of the stochastic oscillator is turning slightly down suggesting a potential downside retracement in the near term. In case of stronger upside pressures the pair could hit the 0.9280 resistance, identified by the peak on March 25. Above that, the 0.9385 barrier from March 23 could attract attention as well. [..]

post-image

Technical Analysis – GBPUSD turns higher from 2-month low

Posted on May 29, 2020 at 7:51 am GMT

GBPUSD has been in ascending mode after the rebound on the two-month low of 1.2075, challenging the 1.2360 resistance level in the 4-hour chart. The technical indicators are currently proposing that the buying interest may continue as the 20- and 40-day simple moving averages (SMAs) are following, the price action and posted a bullish crossover in the preceding sessions. The MACD is surpassing the trigger line and is ready to strengthen its momentum, while the RSI seems to be stabilizing in the [..]

Technical Analysis – AUDJPY rally stalls near 200-day SMA; trendline in focus

Posted on May 29, 2020 at 7:44 am GMT

AUDJPY maintains a clear uptrend in the short-term picture, well supported by an ascending trendline, but now must face the 0.7150 level and the 200-day simple moving average (SMA), which appeared a strong resistance this week, to continue the bullish retracement of the virus-led sell-off. The RSI and the MACD are currently reflecting a weakening positive bias as the indicators seem to be losing steam. Hence, should the price further decelerate, the 70.20 level, which is the 61.8% Fibonacci of the down [..]

Technical Analysis – USDCAD cautiously bearish; declines below base of range

Posted on May 29, 2020 at 7:20 am GMT

USDCAD has found some footing at the 100-day simple moving average (SMA) residing at the 1.3724 key trough, following a break of the foundation of a trading range that commenced around early April. The price has been weakening ever since it tested the ceiling of the horizontal market at 1.4264, backed by the intact negative Ichimoku lines. Promoting additional weakening in price is the declining 50-day SMA and the MACD, which is falling below its red signal line in the [..]

post-image

Technical Analysis – USDCHF extends sideways in a range-bound market  

Posted on May 28, 2020 at 2:30 pm GMT

USDCHF presently below the 0.9700 mark, continues to zig zag above and below the mostly horizontal simple moving averages (SMAs) in a directionless market that has endured since early April. Glancing at the short-term oscillators, they too mirror weak directional momentum within the confines of 0.9588 and 0.9800. The MACD is just above its red signal line and barely beneath zero, while the RSI has just dipped below its 50 threshold promoting declines. Moreover, the stochastics are also uncertain around [..]

Risk Warning: Your capital is at risk. Leveraged products may not be suitable for everyone. Please consider our Risk Disclosure.