XM does not provide services to residents of the United States of America.

Technical Analysis

post-image

Technical Analysis – EURJPY dives within Ichimoku cloud; bearish cross within SMAs

Posted on June 11, 2020 at 9:57 am GMT

EURJPY looks to be mostly neutral after an ascent from the May 7 low of the three-and-a-half-month trough of 114.40, returning the price back below the short-term simple moving averages (SMAs) in the 4-hour chart. The short-term oscillators reflect a stall in the positive momentum. The MACD, in the negative area, has moved below its red trigger line and near zero, while the RSI hovers beneath its neutral mark. Additionally, a conflicting bearish picture is currently displayed within the Ichimoku [..]

post-image

Technical Analysis – EURUSD’s bullish hike takes a breather

Posted on June 11, 2020 at 8:05 am GMT

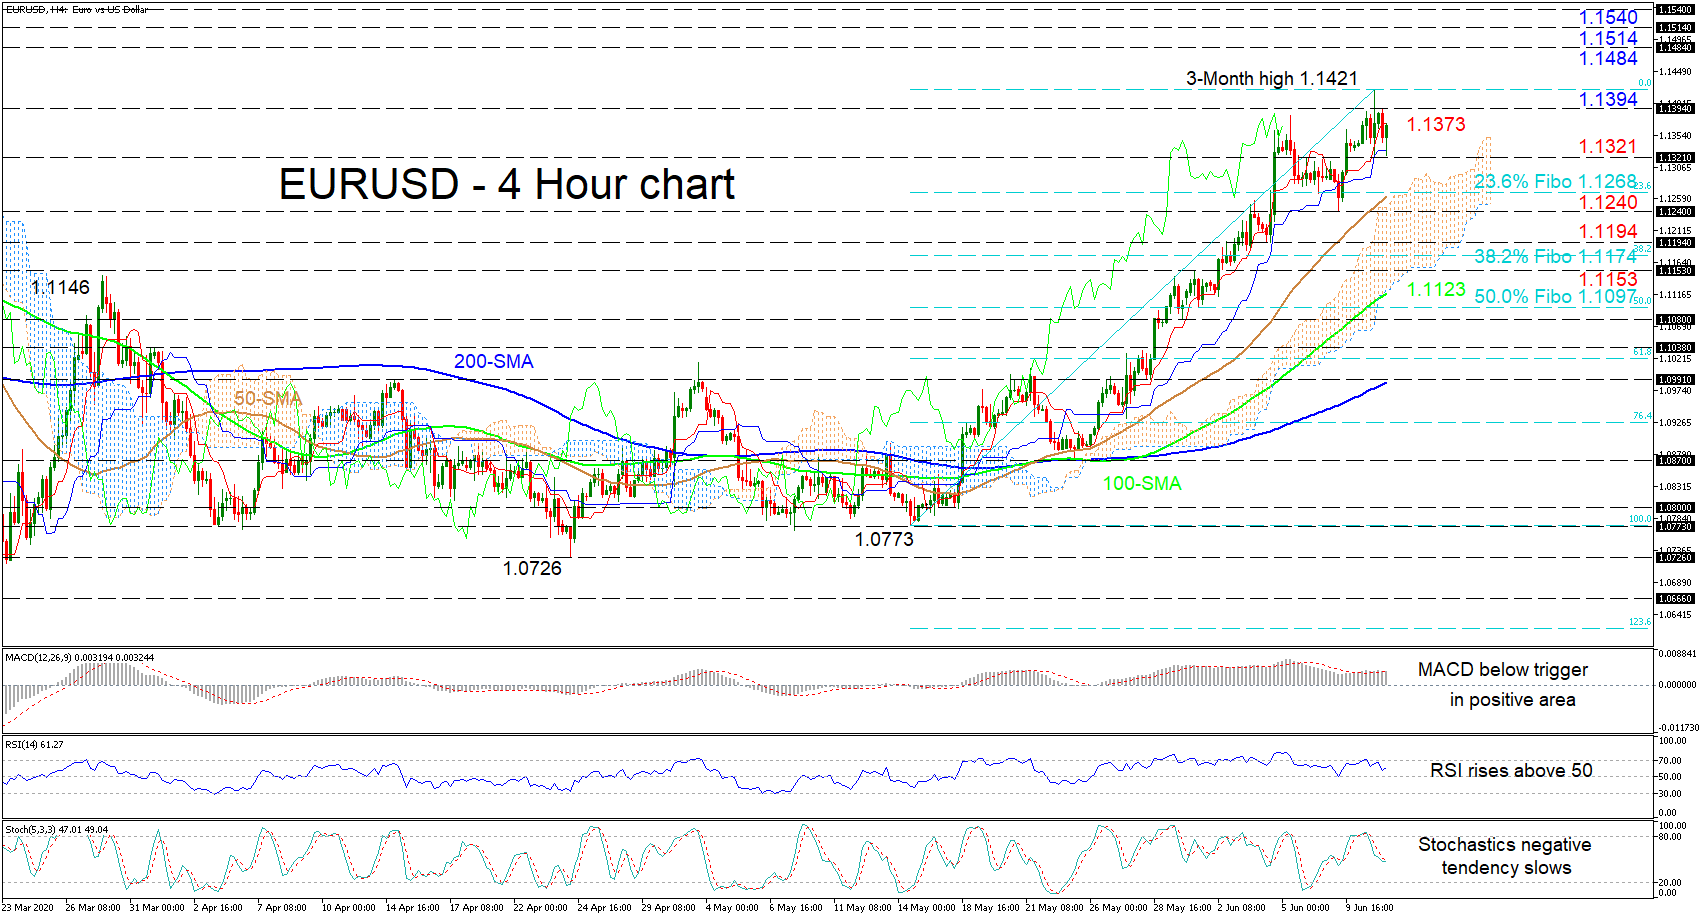
EURUSD’s pullback from the fresh three-month high of 1.1421, looks to be reloading around the 1.1321 swing low. The nearly one-month climb from the 1.0773 mark remains intact, assisted by the Ichimoku lines and the positively charged simple moving averages (SMAs). Glancing at the short-term oscillators, they suggest that positive momentum is strengthening. The MACD, in the positive zone, barely below its red signal line looks to move back above it, while the RSI is improving above the 50 level. [..]

Technical Analysis – AUDUSD rally looks overbought near December’s highs

Posted on June 11, 2020 at 7:46 am GMT

AUDUSD has fully recovered the virus-led sell-off within a narrow upward-sloping channel but December’s peak of 0.7031 managed to stabilize the rally, preventing the bulls to hunt new highs. According to the RSI and the Stochastics the pair is overbought as the former has already topped above 70, while the latter has reversed south and below 80. Hence, downside corrections are highly likely, and traders could seek support near the supportive red Tenkan-sen line currently at 0.6860. A break lower could be trapped [..]

Technical Analysis – WTI futures on a sideline move below 3-month peak

Posted on June 11, 2020 at 7:23 am GMT

WTI crude oil futures is continuing a seven-week rebound but with slower momentum over the last couple of days, reaching a fresh three-month peak near 40.60. The short-term bias looks overbought as the RSI pulled back from the 70 level and is heading south, while the MACD is flattening above its trigger and zero lines. The 40.60 could be a key point for steeper bullish actions if the price manages to break the line. This is also slightly below the [..]

post-image

Technical Analysis – EURGBP flirts with head and shoulders pattern in short term

Posted on June 10, 2020 at 12:19 pm GMT

EURGBP has been in a head and shoulders pattern over the last three weeks and a close below the neckline of the 0.8860 support could endorse this formation, suggesting a downside movement. The 20- and 40-period simple moving averages (SMAs) are acting as strong resistance lines for the bulls and the RSI is moving marginally below the 50 level. Also, the stochastic oscillator is heading south moving towards the oversold zone. Immediate support is coming from the 50.0% Fibonacci retracement level of the [..]

post-image

Technical Analysis – NZDUSD struggles beneath 4-month peak

Posted on June 10, 2020 at 10:20 am GMT

NZDUSD reached overbought levels according to the RSI and found strong resistance just after touching a four-month high of 0.6580.  Also, the MACD is holding above its red trigger line, which supports the bullish view, while the 20-day simple moving average (SMA) keeps increasing its distance above the 40-day SMA, suggesting that the recent upward move is likely to stay in place for now. In case the pair maintains its upward trajectory, the bulls could challenge the next resistance at 0.6665, taken from the minor peak on January 16, before hitting the December’s high of 0.6750. Alternatively, a [..]

Technical Analysis – US 100 index surges to record high; bullish in long term

Posted on June 10, 2020 at 7:50 am GMT

The US 100 cash index skyrocketed to a fresh all-time high of 10,017.20 earlier today, stretching its bullish outlook from the 14-month trough of 6,635 posted on March 23. According to the momentum indicators the strong bullish tendency could continue as both the RSI and stochastics are continuing to flirt with overbought levels. The RSI has just jumped above the 70 level, remaining above the rising line, while the stochastic is pointing up, posting a bullish crossover within its %K [..]

post-image

Technical Analysis – GBPJPY cautiously positive; pullback holds above MAs

Posted on June 10, 2020 at 7:43 am GMT

GBPJPY is currently fixed at the 136.94 level, that being the 61.8% Fibonacci retracement of the down leg from 144.94 to the 41½-month low of 123.97. The pair’s retreat from the fresh three-month high of 139.73 may edge towards the 50-period simple moving average (SMA) and the Ichimoku cloud. This is also reflected by the negative momentum from the red Tenkan-sen line and the stalled state of the blue Kijun-sen line. The MACD has weakened below its red trigger line [..]

Technical Analysis – USDJPY snaps four-day winning streak; closes below trendline

Posted on June 10, 2020 at 7:32 am GMT

USDJPY rotated aggressively to the downside after crawling as high as 109.84 on Friday, slumping below the ascending trendline drawn from the 101.17 bottom and back into the 107.00 zone. The pair erased four green candles and the spotlight is now on the 23.6% Fibonacci retracement level of the short-term downleg from 111.70 to 105.97, which is intersecting with the upper surface of the Ichimoku cloud at 107.33. If the bears manage to remove this obstacle, confirming the negative signals [..]

post-image

Technical Analysis – USDCAD rebounds on 3-month low, surpassing 20-period SMA

Posted on June 9, 2020 at 1:28 pm GMT

USDCAD has been in declining movement over the last month but is currently trading above the three-month low of 1.3360. The stochastic oscillator is approaching the overbought zone; however, the RSI is pointing down after the touch on the neutral threshold of 50. Also, the red Tenkan-sen line is holding below the blue Kijun-sen line, suggesting more losses in the near term. A downfall below the 20-period simple moving average (SMA) could find immediate support at the three-month low of [..]

Risk Warning: Your capital is at risk. Leveraged products may not be suitable for everyone. Please consider our Risk Disclosure.