XM does not provide services to residents of the United States of America.

Technical Analysis

post-image

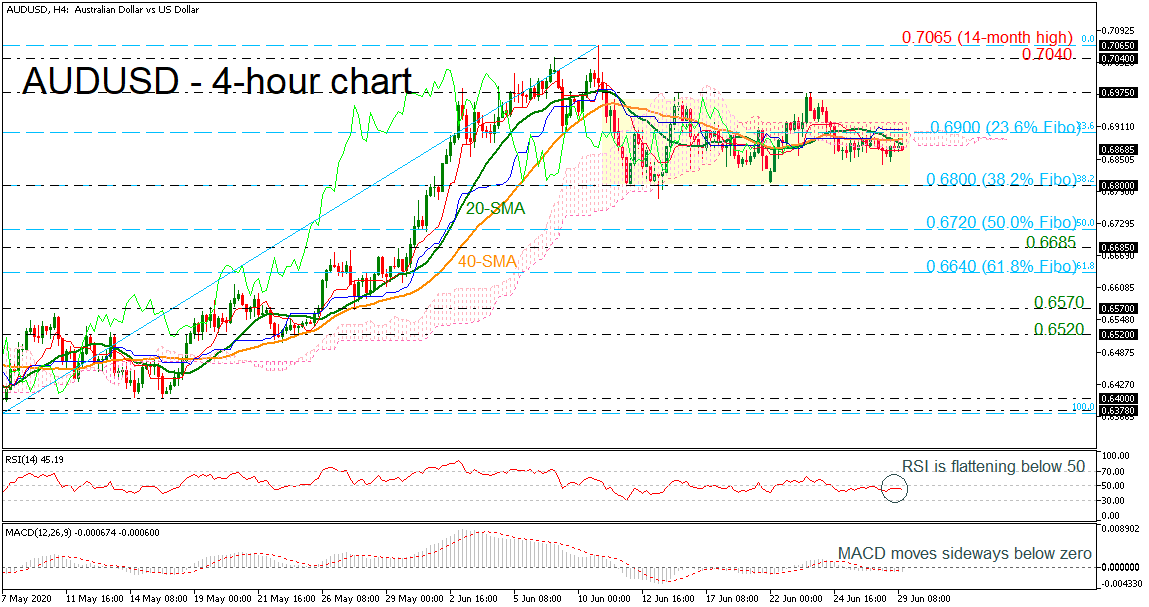
Technical Analysis – AUDUSD moves sideways below 0.6900; positive momentum in medium term

Posted on June 29, 2020 at 9:57 am GMT

AUDUSD has been on the sidelines over the last two weeks as the 0.6975 resistance and the 0.6800 handle seem to be a real struggle for traders. Technically, the price could lose some ground in the short-term as the RSI is flattening below 50, while the MACD is flirting with its trigger and zero lines. A pullback on bearish cross within the 20- and 40-period simple moving averages (SMAs) and the lower surface of the Ichimoku cloud could keep the pair [..]

post-image

Technical Analysis – USDJPY edges sideways as progress remains capped

Posted on June 29, 2020 at 9:35 am GMT

USDJPY appears to be maintaining a horizontal trajectory trapped between the 200-period simple moving average (SMA) and the 50-period SMA. A paused state of directional momentum is reflected in the Ichimoku lines, while the price rests around the upper surface of the Ichimoku cloud. The mixed signals in the short-term oscillators further reflect the stall in the price. The MACD has barely inched above its red trigger line in the positive region, while the RSI improves from its neutral mark. [..]

Technical Analysis – EURUSD’s downside correction may be temporary

Posted on June 29, 2020 at 7:23 am GMT

EURUSD seems to be trading within a downward-sloping channel on the daily chart which seems to be part of a bullish flag formation created after the steep rally to 1.1421. The pattern is a positive signal that the downside correction in the price is temporary and the market could soon resume its upward direction once the bulls smash the upper surface of the channel. The fact that the 50- and 200-day simple moving averages have (SMAs) have positively crossed each other after three [..]

Technical Analysis – Gold trades near almost 8-year peak; still bullish

Posted on June 29, 2020 at 7:19 am GMT

Gold prices are continuing the upside movement, creating new highs and touching an almost eight-year peak at 1,779. The short-term technical indicators are neutral-to-bullish and point to a somewhat stronger market. The MACD is holding well above its zero and trigger lines, while the RSI is hovering in positive territory. The Ichimoku lines are also suggesting a bullish bias as the red Tenkan-sen line is standing above the blue Kijun-sen line and the cloud is looking for more upside movements. [..]

post-image

Technical Analysis – NZDUSD consolidates recent gains; negative risks present

Posted on June 26, 2020 at 12:57 pm GMT

NZDUSD’s positive picture appears to withstand negative pressures, glued just under the 50- and 100-period simple moving averages (SMAs) and holding just inside the Ichimoku cloud. The pair has adopted a horizontal tone over the last weeks, something also mirrored in the unclear Ichimoku lines and the mostly horizontal state of the Ichimoku cloud. Presently above the 0.6380 level, the predominant bearing is positive, something also reflected within the 100- and 200-period SMAs in spite of the failing and lagging [..]

post-image

Technical Analysis – US 30 index pauses its upside rally below 200-day SMA

Posted on June 26, 2020 at 11:26 am GMT

The US 30 cash index has lost its strong positive momentum after the pullback from the three-and-half month high of 27,369 on June 9. The price found strong resistance at the 200-period simple moving average (SMA) over the last few days and is still consolidating above the 23.6% Fibonacci retracement level of the up leg from 18,145 to 27,639 at 25,340. According to the technical indicators, the MACD is losing ground below the trigger line, while the RSI is moving [..]

Technical Analysis – GBPJPY retreats under SMAs; neutral mode returns

Posted on June 26, 2020 at 8:32 am GMT

GBPJPY has calmed just under the 50-day simple moving average (SMA) after the price reversed from the 139.72 mark back below the SMAs, thus reverting the pair to the previous neutral structure. Although the negative tone in the 50- and 100-day SMAs is intact, the sideways lingering in the former and the flattened state of the 200-day SMA, reflect the stalled mode present in the pair. Glancing at the short-term oscillators, they presently suggest weak directional momentum but lean towards [..]

post-image

Technical Analysis – GBPUSD may show some volatility; bears in favor

Posted on June 26, 2020 at 8:20 am GMT

GBPUSD has been making tiny steps within the 1.2400 area in the four-hour chart over the past two days, sending an early warning that some volatility, or a more noticeable move, may soon emerge in the market. Technically, there are several reasons to believe that a downside correction is more likely to occur. First, the price hit a strong wall in the crossroads of a support-turned-resistance trendline and a downward-sloping trendline on Wednesday and instead drifted lower, keeping the downtrend [..]

Technical Analysis – USDCAD stuck below 23.6% Fibo; medium-term outlook still negative

Posted on June 26, 2020 at 7:15 am GMT

USDCAD came close to break the 23.6% Fibonacci retracement level of the down leg from 1.4668 to 1.3310, around 1.3635, several times in the preceding week without success. Still, it managed to hold above the 200- and 20-day simple moving averages (SMAs). The market could retain the range-bound trading in the short-term as the RSI is standing near its 50 neutral mark and the MACD is moving along its trigger line and towards zero. However, the %K line of the stochastic oscillator is approaching the overbought zone, suggesting [..]

post-image

Technical Analysis – Palladium futures test floor of sideways market

Posted on June 26, 2020 at 5:09 am GMT

Palladium futures have consolidated below the 1,853 level, that being the 50.0% Fibonacci retracement of the up leg from 1,353 to 2,354, after yesterday challenging the bottom of a one-month trading range. The latest negative push within the range has some backing from the bearish overlaps of the mostly horizontal 200-period simple moving average (SMA) by the downward sloping 50- and 100-period ones. Nevertheless, the negative bearing within the short-term oscillators has paused and thus a bounce from the foundation [..]

Risk Warning: Your capital is at risk. Leveraged products may not be suitable for everyone. Please consider our Risk Disclosure.